Need some suggestions to do this. I have a table that has two columns that look like this.
A 2
B 3
C 2
A 1
B 2
B 1
C 1
D 1
D 2
The letters represent books going through an interlibrary process. The book is requested to the first library and then if not available, go to the second library, etc. The numbers represent that progression. So A 1, A 2, says that the book was provided by the second library. In other words, the highest number represents, how many libraries it took to get the book. So in the example above, A was fulfilled by the second library, B by the third library, etc.
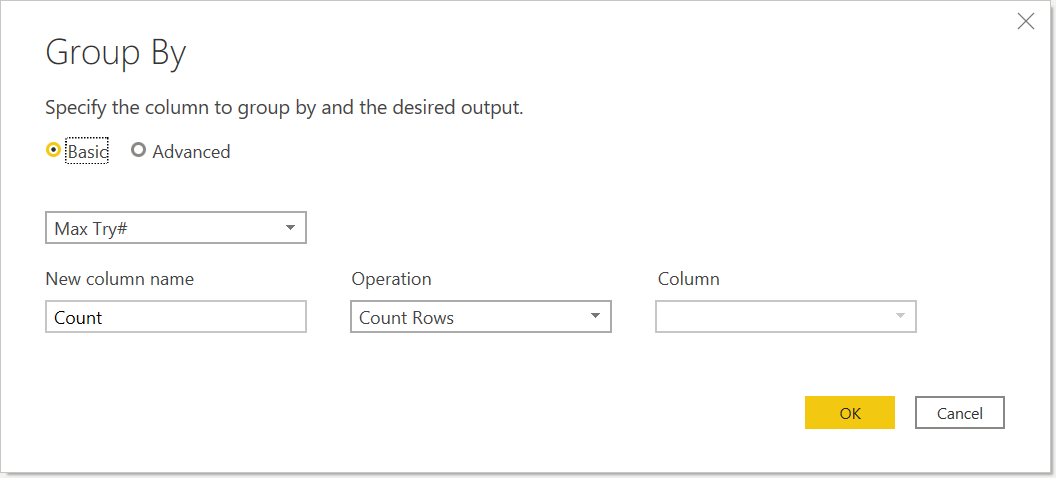
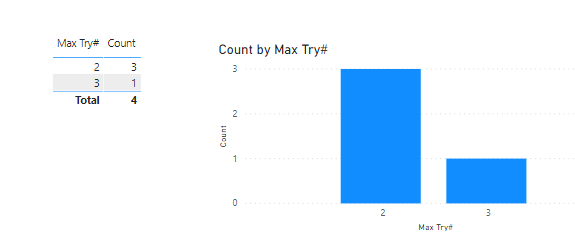
Since the purpose of the library is to get the book in the lowest number of tries, I am trying to do a visualization that has the frequency for the highest number of times to get each book. So something like this:
1 30
2 23
3 20
Etc.
So the table above tells me that books were fulfilled by the first library 30 times, by the second library 23 times, etc. With that, I can do a visualization to measure the effectiveness of the interlibrary process.
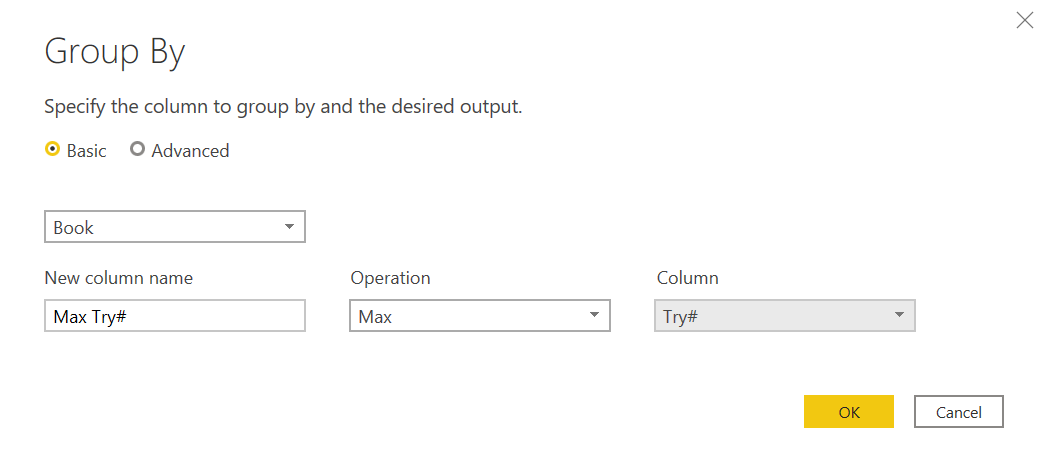
I tried the following. I used Summarize to get a table with the A B and C with their corresponding highest number for all books. That creates a separate table from which I can do the second table above. Since I used summarize, I ended up with a separate table. So I cannot do any filtering, like if I want to separate by years, etc.
Any ideas on how to do this better?
P.S. I am a professor just starting with PBI so I can teach my students. This is a data set we got from the library to play with.
Hi @dsirias, did the response provided by @BrianJ help you solve your query? If not, how far did you get and what kind of help you need further? If yes, kindly mark as solution the answer that solved your query. Thanks!
Hey Thanks, Brian. We are being asked by an accreditation body for business schools to include data analytics for ALL students. So, I researched several possibilities and decided on Power BI. I know just a little and adventured myself to get a data set from our library and got stuck with it. I was able to cheat in Excel. I did a pivot table first, copied and pasted the result, and did another pivot table on it. I was sure it was possible to do it in PBI but I reached the end of my knowledge very quickly I subscribed to the membership to learn more!
OK great, thanks! I was able to replicate what you did an got the same result as I did with Summarize but how do I filter? It seems I end up in the same situation with just an extra table all alone, without the possibility of filtering.
Let’s say that the table “Book” has in addition to the two columns, another column for date. Now I would like to check only 2020 data. How do I do that?
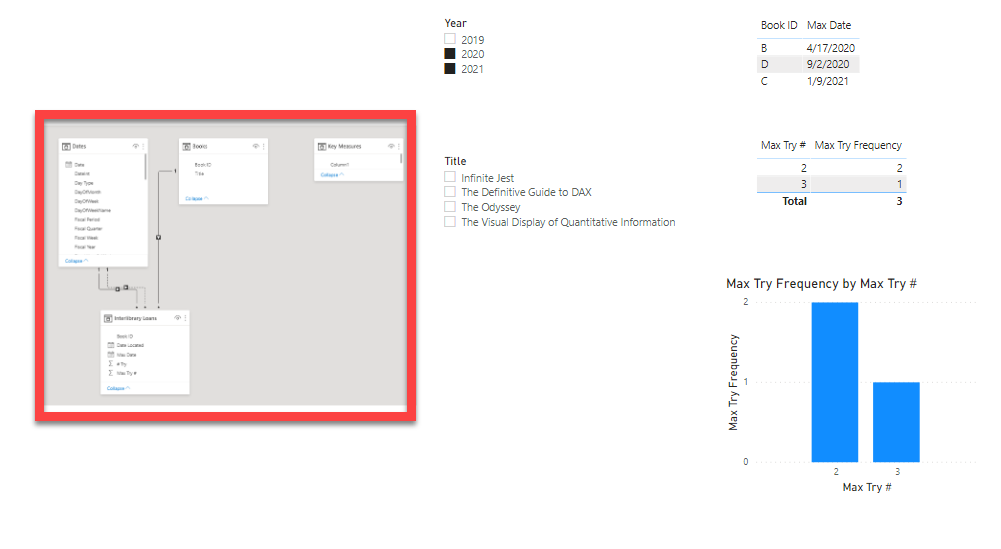
To do that, you will need to develop a more full-blown data model with dimension tables related to your fact table. I’ve put together a simple strawman star schema data model, illustrating how that might be done. Once that’s in place, you can start slicing on any of the dimensions in those tables. Note that with the changing requirement to make this dynamic within the context of a report session, I needed to do less aggregation in Power Query than the solution I provided you prior, but augment that with a DAX measure to do the frequency count.
Normally I would provide you more comprehensive explanation, but given that it’s past 4 AM, I need to leave it at that for now. I’ve attached my full solution file. Please take a look, and if you have questions I’m happy to address those tomorrow.
I hope this is helpful. Revised solution file attached.
Thank you, Brian…sorry you were working that late. I see what you did. There was no way I could have thought of something like this. It needed a PBI genius to figure it out. I really appreciated your time and effort.
Thanks for the kind words, but there’s no genius needed for this one this - follows right from the standard “four pillars of PBI” playbook that underlies all of the Enterprise DNA coursework (data prep, data modeling, DAX/analysis and visualization). We’ll have you doing stuff like this in no time.
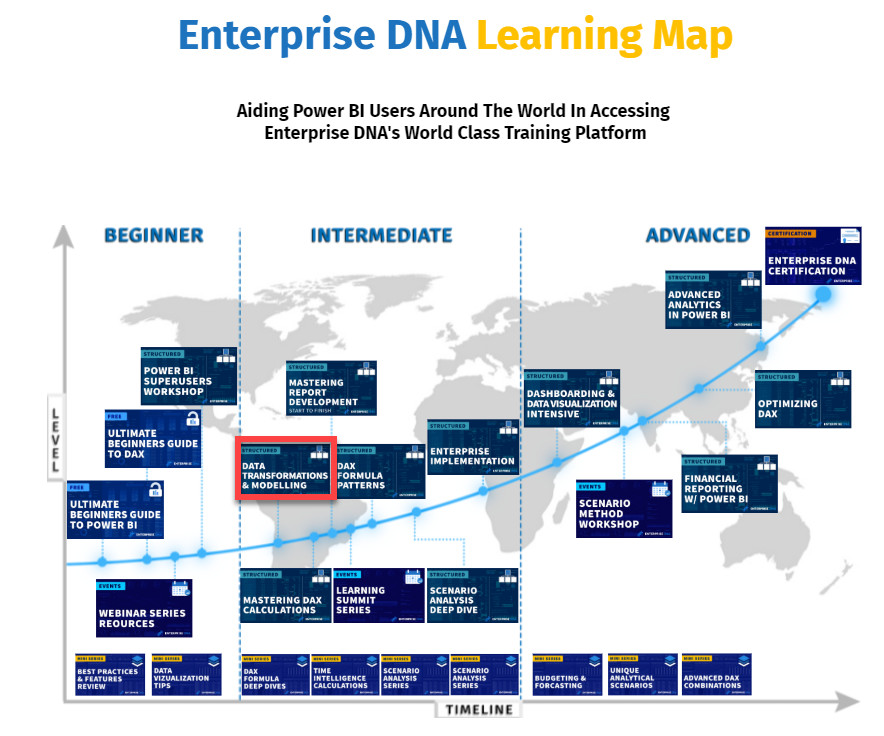
If you haven’t already, I would strongly recommend taking the Data Transformation And Modeling course on the portal. This goes through all the concepts used in putting this solution together, and provides a great foundation for building data models specifically optimized for Power BI. If you get your data prep and data modeling right, often your DAX dramatically simplifies.
 I subscribed to the membership to learn more!