Need help with DAX, Salesforce (CRM) analysis

Hi All,

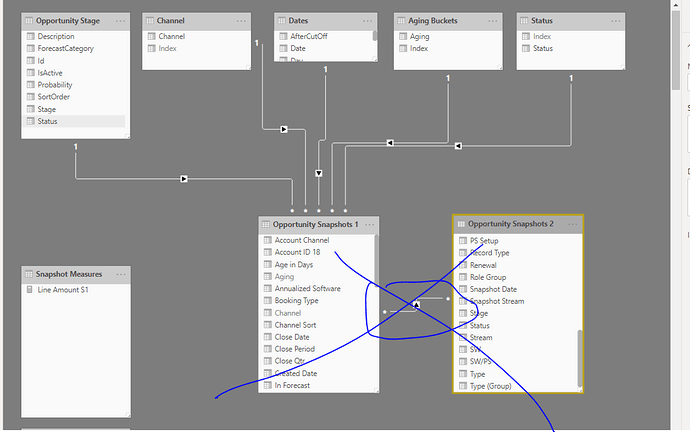
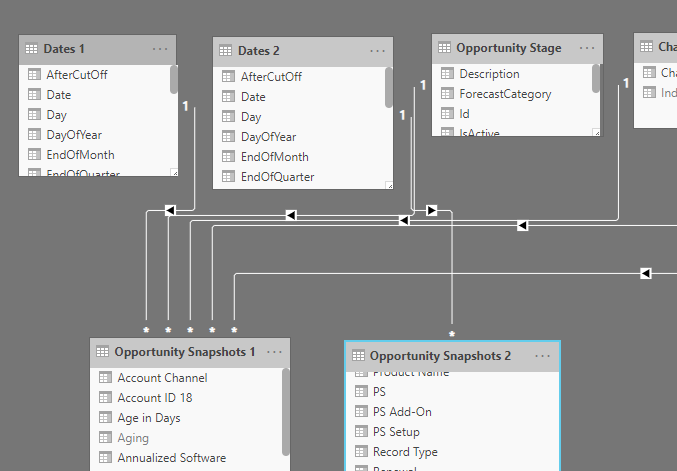
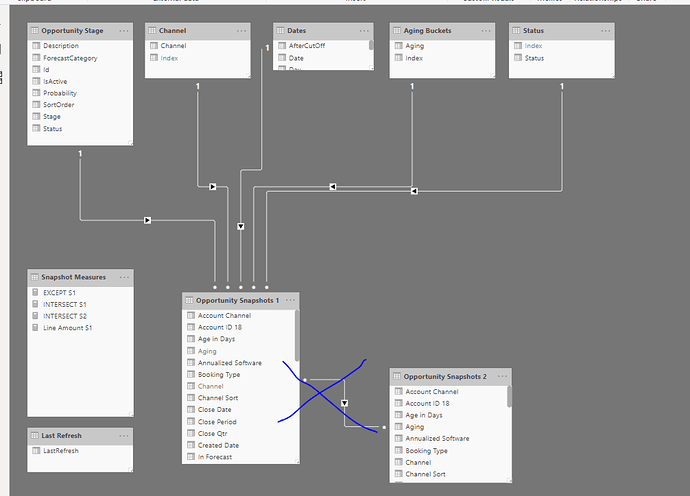
I created a table (table name: Snapshot 1) using salesforce opportunity snapshots where the opportunity table is captured every 1st of each month and tagged every records with Snapshot Date (e.g. 4/1/2019, 5/1/2019, etc.). I then duplicated Snapshot 1 as Snapshot 2 and linked using opportunity id, many-to-many cardinality, cross-filter direction is Snapshot 1 filters Snapshot 2.

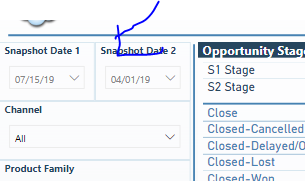
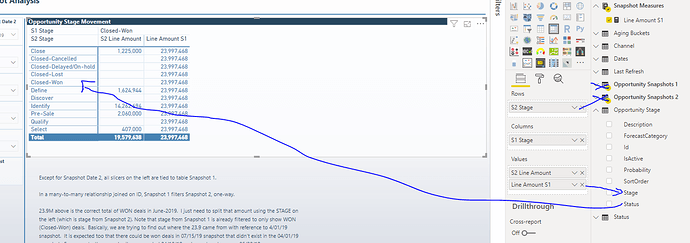
I have 2 snapshot date slicers - one for Snapshot 1 and another one for Snapshot 2. In my testing, I set Snapshot 1 filter to 7/1/2019 and Snapshot 2 filter to 4/1/2019. I also filtered Snapshot 1 stage = Closed-Won. I then created a matrix with Opportunity Stage from Snapshot 2 in Rows and Opportunity Stage from Snapshot 1 in Columns. I then added the amount field from both snapshot tables to Values.

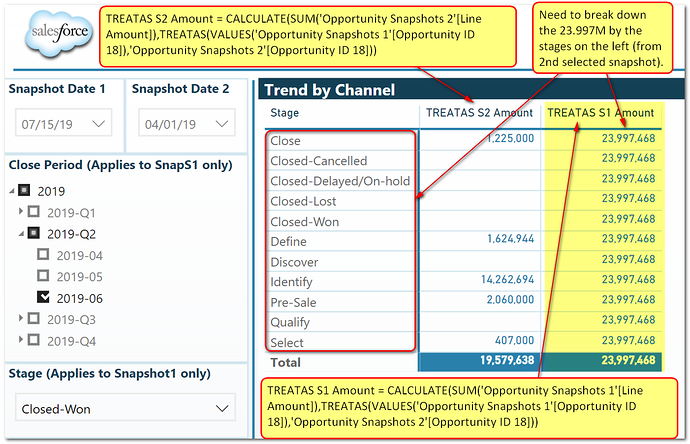
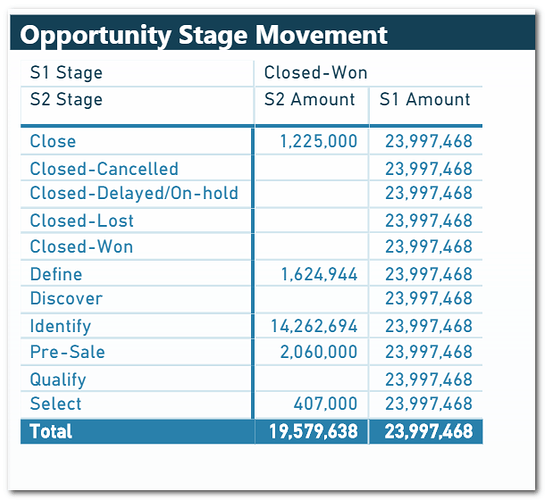
Here’s a screenshot of the resulting table. I’m getting the correct amounts from Snapshot 2 (since S1 filters S2). But in the Snapshot 1 amount column, I couldn’t split the amount (total won of 23.9M) among the stages from Snapshot 2. Basically, I want to know the composition of the 23.9M won deals in July based on what the stage was back in April.

Here’s my current measure: CALCULATE(SUM(‘Opportunity Snapshots 1’[Line Amount]))
How do I modify this so that the Snapshot 1 amount gets filtered by the Snapshot 2 stages?

Best regards,

Ferdinand
There’s a lot going on here, and it’s difficult to provide a solid answer without seeing an example.

Just guessing here,

You probably just need to a a FILTER function to your CALCULATE measure above.

Something like this.

VAR S2Stage = SELECTEDVALUE( S2 Stage Column)

RETURN
CALCULATE( measure,
       FILTER( S2 Stage table, Column = S2Stage variable ) )

This would be my best guess based on what I can imagine of your model right now.

Thanks
Sam

Hi,

Thanks for the quick reply. Below is the link to my pbix file. I tried using filter but didn’t get the correct break down of the 23.9M. I ended up getting an amount only if the opportunity exists in both snapshots. That’s not what I want. All won opportunities in the Snapshot 1 table should be included even if there is no matching opportunity in Snapshot 2 table.

https://drive.google.com/file/d/1JW89ORwcWFSynWSu0z6ZfdoRnndrPBZJ/view?usp=sharing

Best regards,

Ferdinand

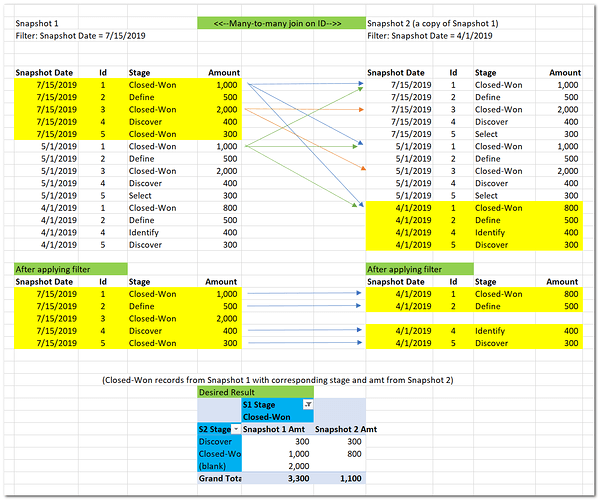
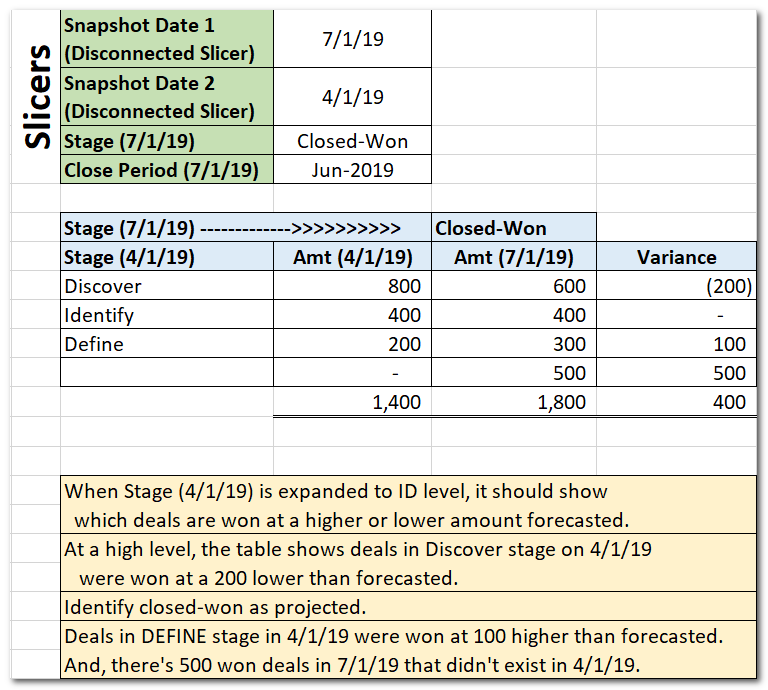
Here’s a representation of the result I’m trying to get.

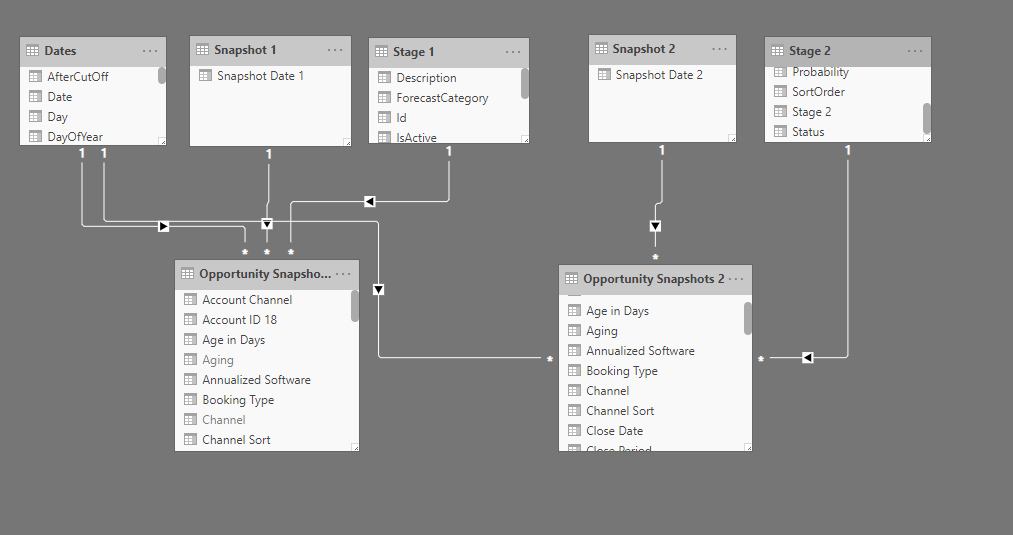
I’ve had a look at the model here and I’m a bit confused as to the setup.

Why do you have it like this where you have duplicated the same table and joined them up?

I just don’t believe this is how you want to set this up.

You likely just want to have two date tables and link them up to either one or both of these tables.

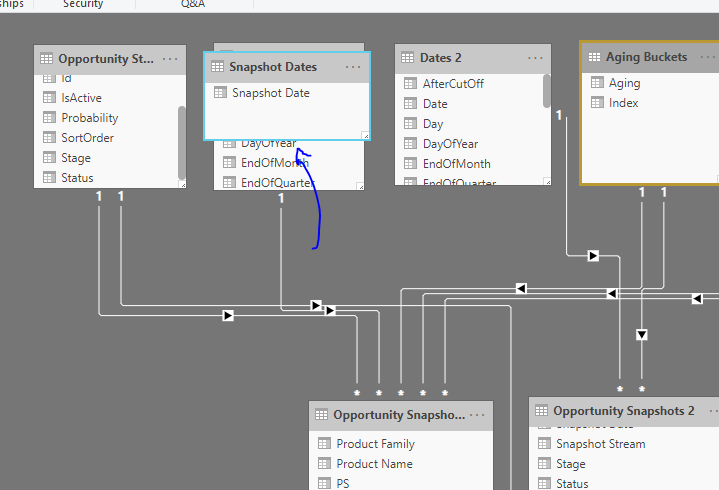
Any date selections should come from date tables only

image

Here’s what I would do initially,

Set up two dates tables. Link one each to the opportunity tables. (Get rid of the many to many relationship here…I never recommend doing anything like this)

Then also link up all the other relationships within your model. Make sure to use what are in your lookup tables in your matrix.

For example Stage, should come from the Opportunity Stage table.

I think here it’s all about getting the model set up correctly. Then everything should be much easier from there.

Sam

Thank you very much for the insights.

I actually came across the videos on TREATAS and INTERCEPT and I think one of these (or both) is what I need.

I have a table with say 6 columns - Snapshot Date, ID, Stage, Close Date, Product and Amount. Every month we take a snapshot of our Salesforce opportunity data and append it to the dataset with the appropriate snapshot date.

I want to be able to select 2 snapshot dates (for example 7/1/19 and 4/1/19) and show only the Closed-Won stage from the 7/1/19 snapshot with Close Date in a specific month (e.g. deals Closed-Won in June 2019) and break it down to ALL stages from the 4/1/19 snapshot.

There are one or more records per ID (due to products). There will be IDs in 7/1/19 that are not in 4/1/19 if the record didn’t exist yet when 4/1/19 was captured.

Also, the deals that are Closed-Won stage in June 2019 from the 7/1/19 “batch” will actually have different stages in the 4/1/19 “batch”.

The result should look something like this:

My initial thoughts were:
1.) Create 2 disconnected slicers for choosing two snapshot dates.
2.) Duplicate the snapshot table so that the 2 disconnected slicers can filter each independently.
3.) Then somehow join the 2 tables (after they are filtered) using the ID. Because the ID is not unique, my only option was many-to-many. I also selected one way filtering.

When I cam across the videos on TREATAS and INTERSECT, now I’m redoing this thing without joining the 2 tables. These are my current measures. The one for the 2nd snapshot date (4/1/19) works fine but the other one (for 7/1/19) is not getting broken down by the stages from the 4/1/19 snapshot.

TREATAS S1 Amount = CALCULATE(SUM('Opportunity Snapshots 1'[Line Amount]),TREATAS(VALUES('Opportunity Snapshots 1'[Opportunity ID 18]),'Opportunity Snapshots 2'[Opportunity ID 18]))

TREATAS S2 Amount = CALCULATE(SUM('Opportunity Snapshots 2'[Line Amount]),TREATAS(VALUES('Opportunity Snapshots 1'[Opportunity ID 18]),'Opportunity Snapshots 2'[Opportunity ID 18]))

Best regards,

Ferdinand
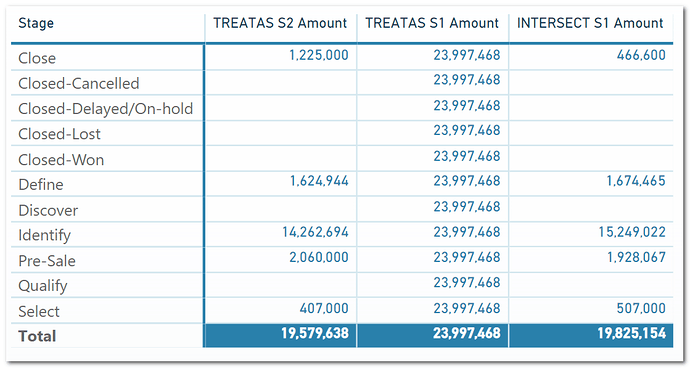
I tried using INTERSECT and the 23.9 got broken down according to STAGE from 4/1/19 snapshot BUT it is missing the amount for those deals that are IN 7/1/19 but NOT IN 4/1/19.

INTERSECT S1 Amount = CALCULATE(SUM('Opportunity Snapshots 1'[Line Amount]),INTERSECT(VALUES('Opportunity Snapshots 1'[Opportunity ID 18]),VALUES('Opportunity Snapshots 2'[Opportunity ID 18])))

Best regards,

Ferdinand
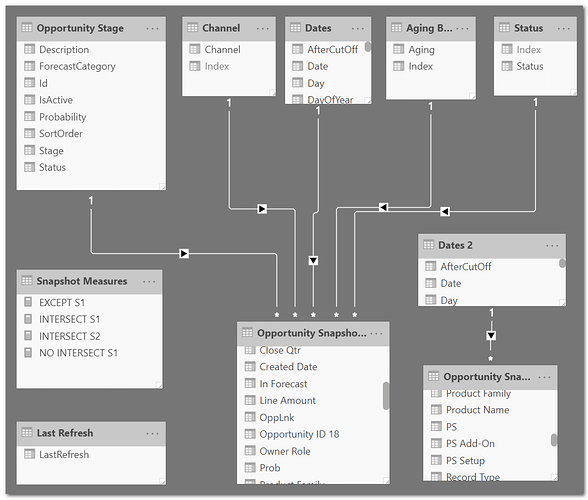
Have you explored the ideas I suggested on this one?

Why can’t you just use two date tables and use those as your filters?

I don’t believe you need to use TREATAS here. Two active relationships should be fine from what I can tell.

image

This is the strategy I would use here.

Thanks
Sam

Hi,

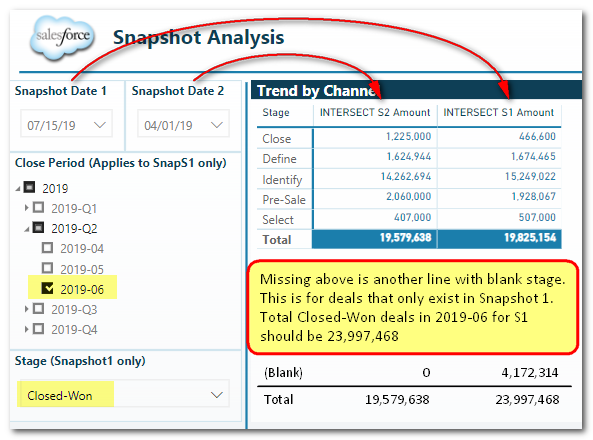
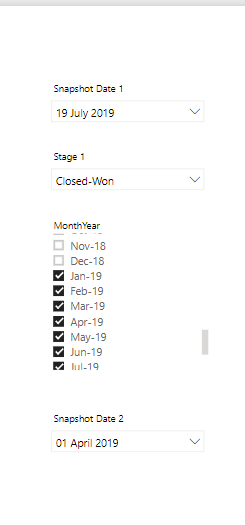
Followed your suggestion and only used INTERSECT. I’m still missing a line for deals that only exist in one snapshot and didn’t exist at the time the other snapshot was taken. What am I missing? Please note that there are 2 extra filters that only apply to the 7/15/19 snapshot - STAGE = Closed-Won, and Close Date = 2019-06. For the 4/1/19 snapshot, the only filter is snapshot date = 4/1/19.

image

Best regards,

Ferdinand
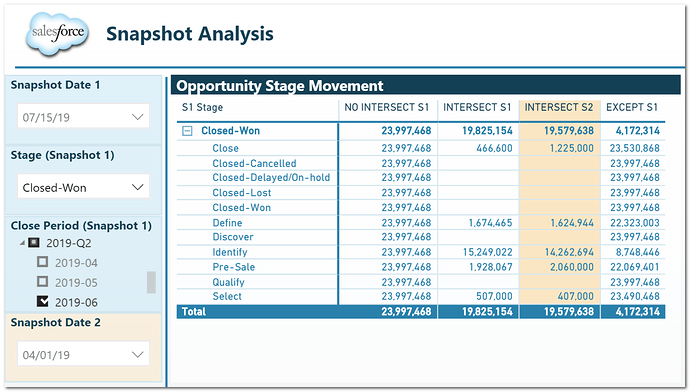
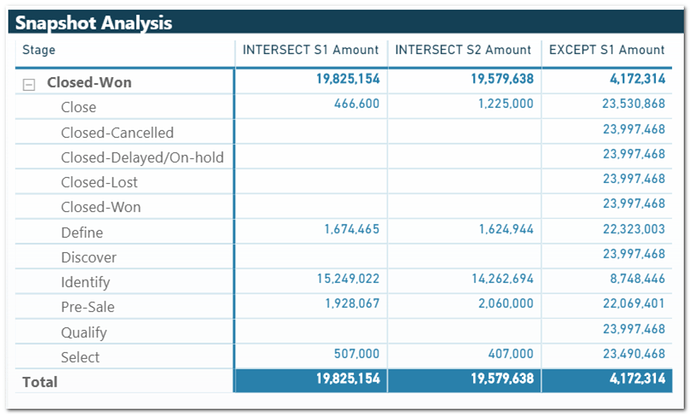
Using EXCEPT, I was able to get to the missing 4,172,314. I just need to be able to show it as part of the


It looks like this when expanded to STAGE from 4/1/19 snapshot.

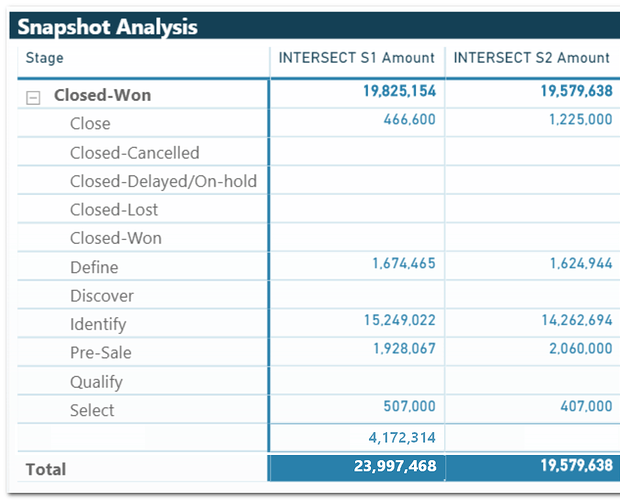
Below is how I want it to look like. Is this doable? I want to see everything in 7/1/19 even if it doesn’t have a matching record in the 4/1/19 snapshot.

Best regards,

Ferdinand
Can you send through your latest example file with this setup and I’ll take a look.

Thanks

Thank you!!!

Here’s the link:

https://drive.google.com/open?id=1qjCVMMBAkTdLBLDxidMT21VJhuLh6G_v

Best regards,

Ferdinand
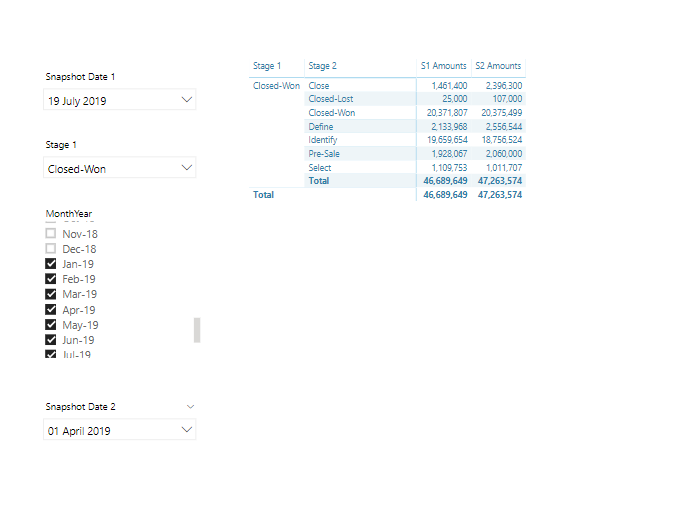
Actually this isn’t too difficult. You just need to change this

image

But I honestly think you’re confusing yourself here.

You shouldn’t need this intersect of the first one. This filtering will just happen naturally based on your model.

Could I also ask why you aren’t using my ideas above about the double date table?

I still don’t see this in your model?

This is not how you should be setting this up

You’re right.

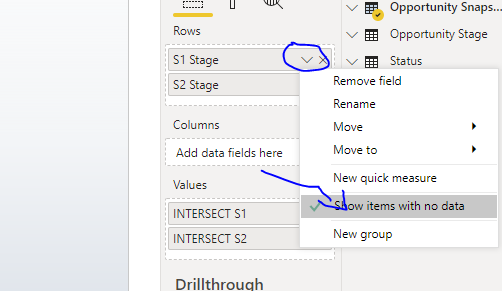
I don’t need to join the snapshot tables since I’m using INTERSECT in my measures. I have removed the join. With regards to removing INTERSECT from the S1 measure, it doesn’t work without the join. The reason I wasn’t using a date table is that only want to show the available snapshot dates as filter choices (typically 1 per month). But I went ahead and joined a second date table to the Snapshot 2 table. I also checked the option “Show items with no data” but it still didn’t show the line with blank stage (from S2) with the amount 4,172,314 under S1 column and S1 total should be 23,997,468.


Link to revised pbix.
https://drive.google.com/file/d/1tgArUtcwwQagvmC-ivkGhUBB70JlyPcD/view?usp=sharing

Best regards,

Ferdinand
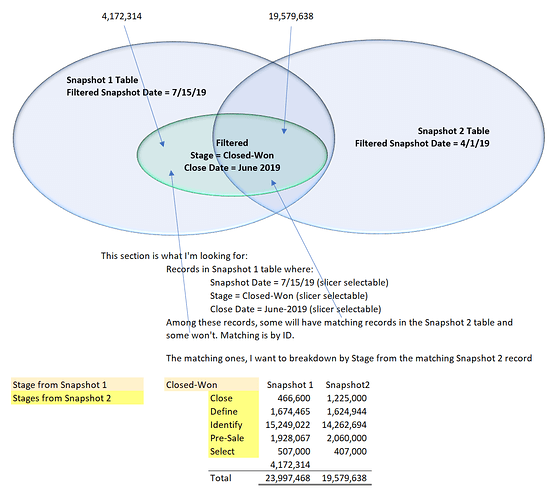
Visual representation of what I’m looking for.

Also tried simulating what I want in Excel and this is how it will be like. Just one Snapshot table using itself to lookup/match another snapshot date to compare. And then using it as pivot table data source.

Snapshot Analysis.xlsx (25.4 KB)

Thanks,

Ferdinand

For now, I’m just going to use 3 separate visuals. Link to pbix below.

https://drive.google.com/file/d/1NFXy3CmwY0lkmVJL0UOR3Rj9p0GyFSQt/view?usp=sharing

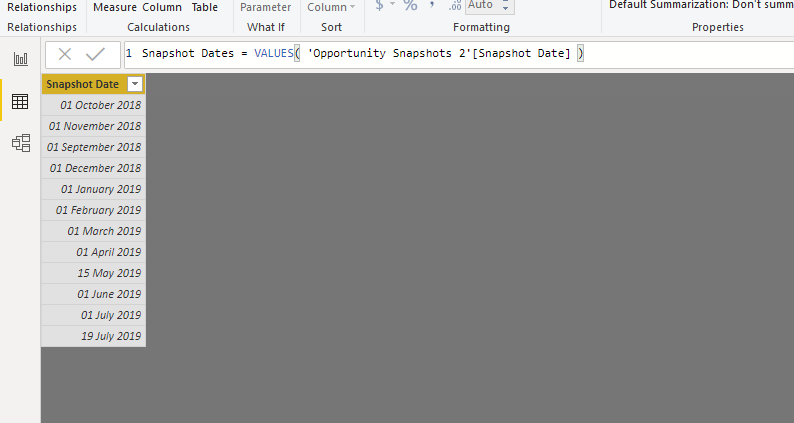
Potentially the other thing to do here, is maybe you actually need to create a table for just snapshot dates rather than the date table.

Something like this.

This then becomes you lookup table.

Rather than the dates tables.

I just had this thought.

Play around with this.

The key here is to get you filters coming from lookup tables.

Then everything should flow relatively seamlessly after that.

Sam

I’ll have one more go at this one and see if I can get you closer to something optimal here.

I’m going to strip the model right back to as simple as can be and might try something a little different that I just thought of.

I’ve gone through and set up everything how I believe it should be setup.

Work with this and see where you get to.

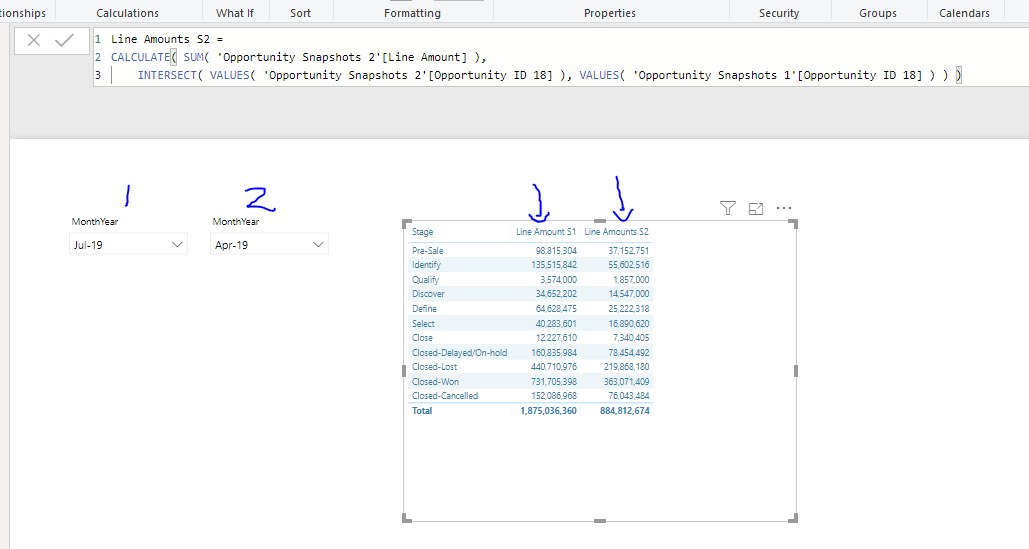
S1 Amounts = 
CALCULATE( SUM('Opportunity Snapshots 1'[Line Amount] ),
    INTERSECT( VALUES( 'Opportunity Snapshots 1'[Opportunity ID 18] ),
        VALUES( 'Opportunity Snapshots 2'[Opportunity ID 18] ) ) )


S2 Amounts = 
CALCULATE( SUM('Opportunity Snapshots 2'[Line Amount] ),
    INTERSECT( VALUES( 'Opportunity Snapshots 2'[Opportunity ID 18] ),
        VALUES( 'Opportunity Snapshots 1'[Opportunity ID 18] ) ) )

I believe this is pretty close but I’m not familiar with the data, so you’ll have to finish it here.

Thanks
Sam