Need help with DAX query, finding latest stage

Hi Team,

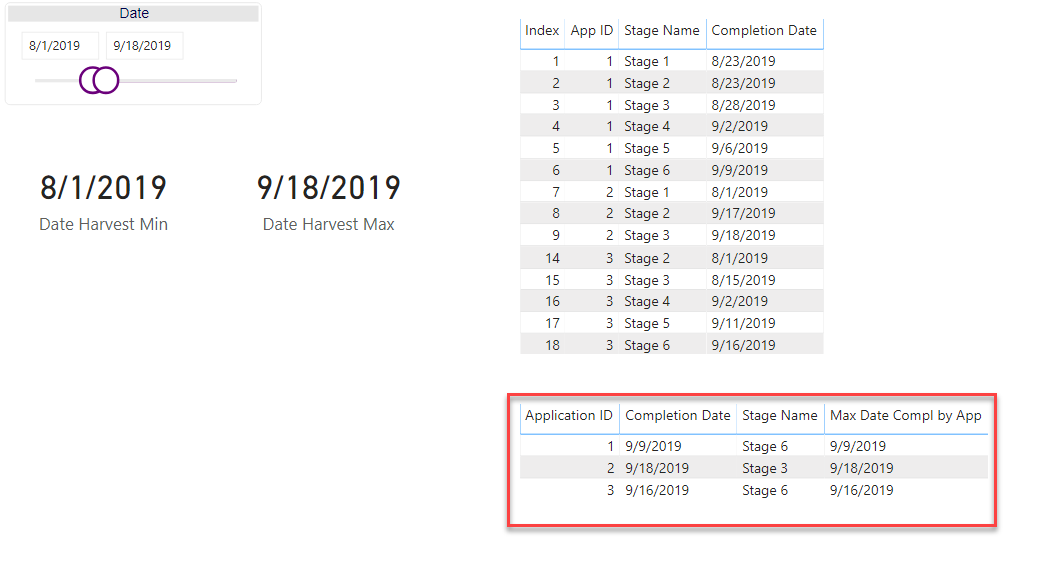
I need help with a DAX calculation. I have a table AppStages which lists the different AppID’s, Stage Name and the Completion Date. The users want to have a filter on the Completion Date such that only the latest Stage of an AppID is shown on the visual.

Example: Consider I have AppID = 1, with Stage 1 completed on 1/1/2019, Stage 2 completed on 2/1/2019 and Stage 3 completed on 3/1/2019.
So when the user selects date range of 1/1/2019 - 31/1/2019 , only the latest Stage 3 should be considered. Right now it shows me all 3 which is not what I want.

I am attaching the pbix file I am working to demonstrate exactly what I am trying to achieve.

Thanks in advance.Test.pbix (68.4 KB) Test.xlsx (11.6 KB)

Sim.

1 Like

Sim2312,

Thanks very much for the clear explanation, and posting the PBIX and Excel files – makes it much easier to provide support .

I did a few preliminary things before diving into the main DAX measure:

  1. Marked your date table as a date table – this is necessary to get the time intelligence functions to operate properly.

  2. Created two measures to harvest the minimum and maximum dates from your date slicer. Here’s the first one:

    Date Harvest Min =

     CALCULATE(
         MIN( 'Date'[Date] ),
         ALLSELECTED( 'Date'[Date] )
     )
    

The second is the same, just substituting Max for Min.

Here’s the measure that does the heavy lifting, calculating the max date of completion by app ID for the selected date range:

Max Date Compl by App = 

VAR MaxDate =
CALCULATE(
    MAX( AppStages[Completion Date] ),
    ALLEXCEPT( 
        AppStages,
        AppStages[Application ID]
    ),
    FILTER(
        'Date',
        'Date'[Date] >= [Date Harvest Min] && 
        'Date'[Date] <= [Date Harvest Max]
    )
)

RETURN
IF(
    SELECTEDVALUE( AppStages[Completion Date] )  = MaxDate,
    MaxDate,
    BLANK()
)

And here’s a screenshot of the results, with the measure max dates and stages by app ID in the red box:

I hope this is helpful. Full solution file posted below.

Hi Brian,

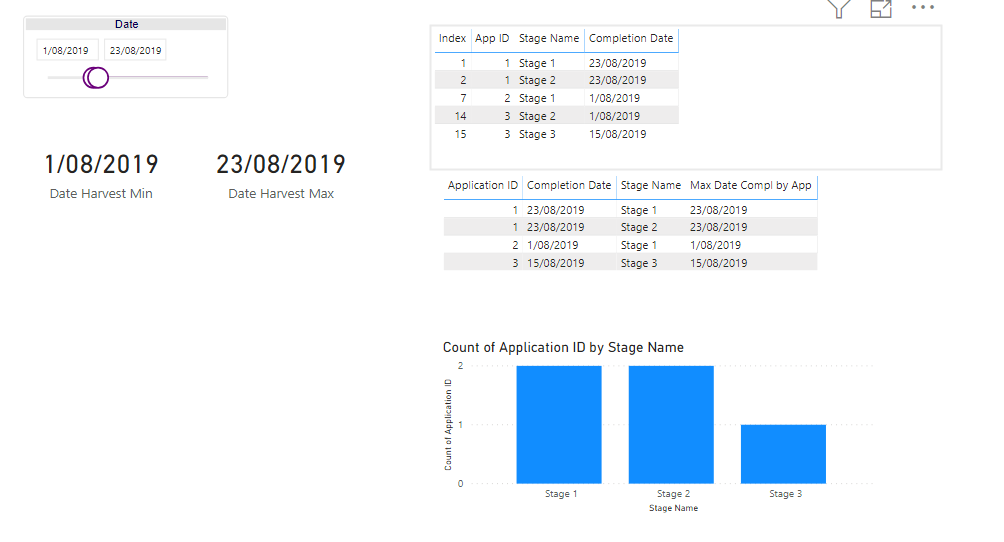
Thank you so much for the solution provided. It works well for Max date. What complicates it is when an Application has completed Stage 1 and Stage 2 on the same day , then in that case I need to consider the max completion datetime.

Also what I am actually trying to achieve is the column chart , where I have the stage on axis and the count of Application ID as the measure. Each of the AppID’s should appear just once based on the Max Stage they are at.

Hope this is clarifies.

Thanks a ton for helping me with this.

Sim.Test_updated.pbix (95.1 KB)

@Sim2312,

Thanks for the clarification. I’m working on the revised measures and making good progress, but need to call it a night. Hope to have a solution for you tomorrow.

  • Brian

Hi Brian ,

Any update on this !

Really appreciate your help.

Thanks,
Sim

@Sim2312,

Sorry - got swamped on a big project at work yesterday and ended up working really late, so didn’t have time to finish this one. Eager to get back to it today, and just need to debug the final portion of the revised measure.

  • Brian

@sim2312,

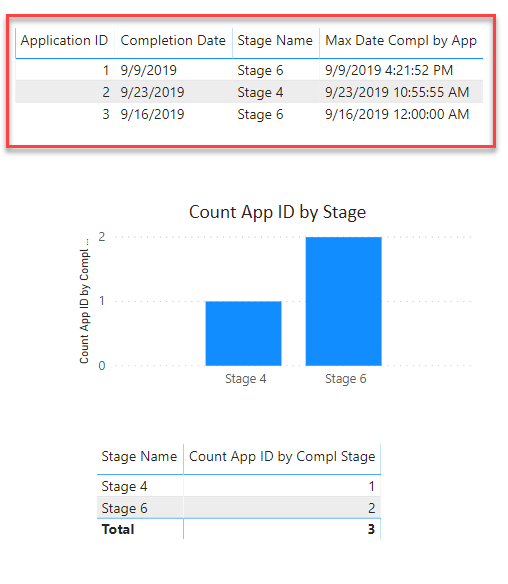
OK, got it. In addition to the Max date measure discussed above (modified to use date and time, rather than just date per above), I created a second measure that basically replicates the table boxed in red below virtually, then runs a count of App ID by Stage Name on that virtual table:

Count App ID by Compl Stage = 

VAR vTable =
CALCULATETABLE(
    ADDCOLUMNS(
        SUMMARIZE(
            AppStages,
            AppStages[Application ID],
            AppStages[Stage Name],
            AppStages[Completion DateTime]
        ),
        "MaxCompDate", [Max Date Compl by App]
    ),
    FILTER(
        'Date',
        'Date'[Date] >= [Date Harvest Min] &&
        'Date'[Date] <= [Date Harvest Max]
    )
)

VAR vTable2 =
    FILTER(
        vTable,
        [MaxCompDate] <> BLANK()
    )
    
RETURN
CALCULATE(
    COUNTX(
        vTable2,
        AppStages[Application ID]
    ),
    VALUES(AppStages[Stage Name] )
)

Note that I could have combined the two variables by wrapping VAR 1 in the FILTER() statement in VAR 2. However, when working with more complex virtual table variables, I like to use a “mini-measure branching” approach to build the table sequentially, which makes it easier (for me, at least) to understand the logic and to debug.

Hope this gets you what you need. Fun problem – enjoyed working with you on this one. Full solution file posted below.

1 Like

Hi Brian,

Thank you so much for the solution provided. It works perfectly.

Appreciate all the help!

Kind regards,
Sim.