Hello everyone,
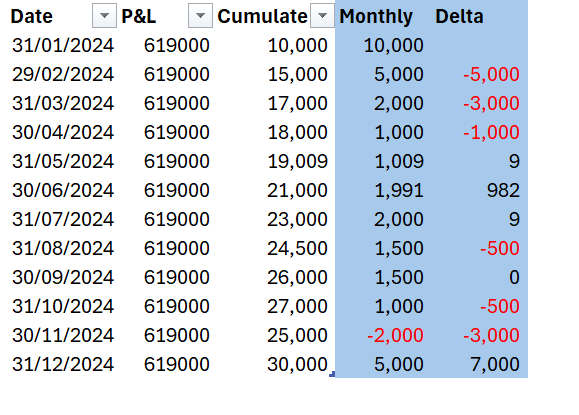
I’m reaching out for some expert advice as I’m facing a challenge in Power BI, specifically with DAX formulas. I’m currently working on a P&L (Profit & Loss) report where the amounts are presented in a cumulative format. My goal is to create a table in Power BI that not only breaks these cumulative amounts down into monthly values but also displays the delta, i.e., the variation from one month to the next.
I’m looking for a method or a DAX formula that could help me efficiently perform these calculations. To give you a clearer idea of what I’m aiming for, I’ve prepared an example illustrated in blue attached herein.
I would greatly appreciate any help, advice, or sample code you might be willing to share to assist me in tackling this issue.
Thank you very much for your time and support.
Test.pbix (32.2 KB)