Hi,
For an analysis I need to figure out the amount of combinations of bad quality categories.
Each delivery is registered by “bonnr” which stands for delivery number. Next each delivery contains the same product however the product comes from different suppliers. Quality reports contain bad quality categories and for each category I need to figure out which combinations of bad quality occur most often.
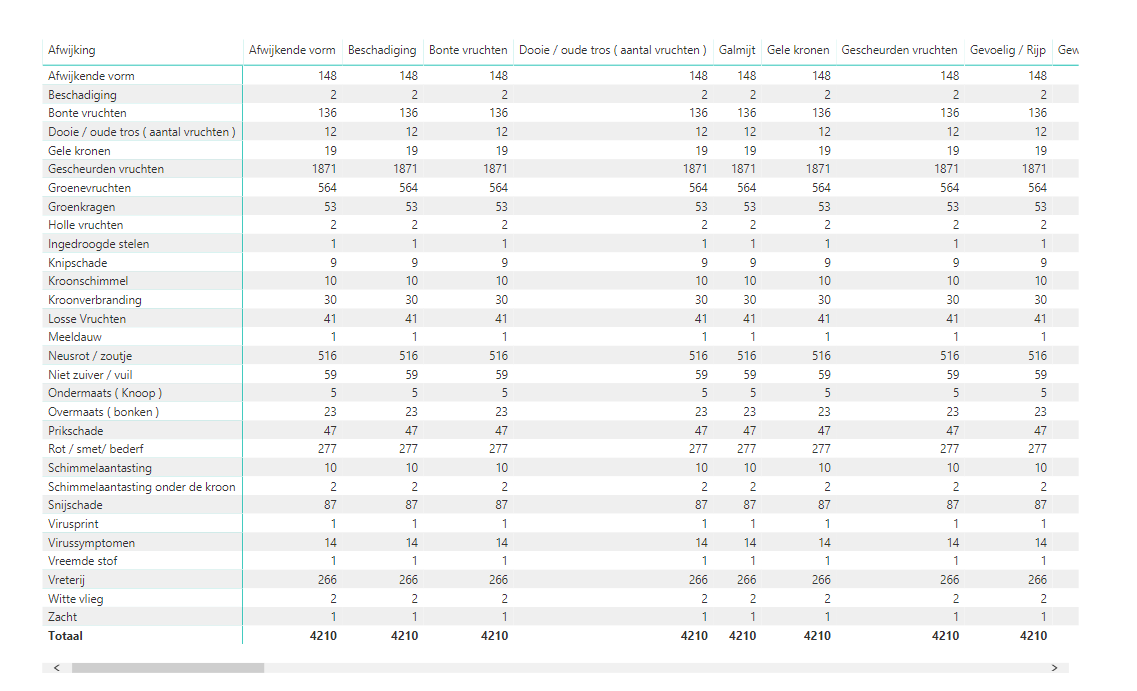
When I saw your video about cross-selling I was thinking about the same approach. However I don’t know how to match the values like in your cross-selling deep dive. The values in the image below represent the times that bad quality has been observed per category (afwijking).
Could you advise with a relevant formula that would fit the scenario?