Hi @Dharma,
Here’s an alternative, just paste each of these in a New Blank Query.
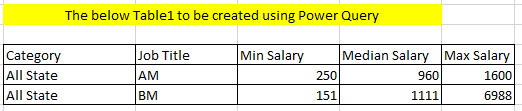
let
    Source = Table.FromRows(Json.Document(Binary.Decompress(Binary.FromText("jdS7bsMwDIXhVyk8ZyApUZcx3Tt1DDJ06JYx748KLpDW+Q+KekiM5AMpXuzLZYu2nbb3+8f909fN69v68DRbX+fb7WX/Y7uelut0JZJuwIWKVyrcnJMs/xmOZRRTjmVEHwPO/Lc77+Xa/uOTq3AzmdY6WHM2zyZYiGjOaB5qFsmsnbXGo9b46TFLjQArihUwF6wMsDnEvCZYVf09nO27I02M3xpdVW7QqbVz5lVb7IUsOS9PsibY5OHUmoTRrYvFPk5X/nzGLOli34qn8xlcWRedw3mqtlS4Jh5ZbwyndsUHw00RL5jWewo3WW42sfGHtuzjUG+e4mAtxYsxwKpihUl7P7LrFw==", BinaryEncoding.Base64), Compression.Deflate)), let _t = ((type nullable text) meta [Serialized.Text = true]) in type table [#"Empl ID" = _t, State = _t, #"Job Title" = _t, Salary = _t, Category = _t]),
    ChType = Table.TransformColumnTypes(Source,{{"Empl ID", Int64.Type}, {"State", type text}, {"Job Title", type text}, {"Salary", Int64.Type}, {"Category", type text}}),
    GroupAll = Table.Group(ChType, {"Category", "Job Title"}, {{"AllRows", each _, type table [Empl ID=nullable number, State=nullable text, Job Title=nullable text, Salary=nullable number, Category=nullable text]}}),
    AddAll = Table.AddColumn( GroupAll, "Temp", each
        let lSalary = List.Buffer( [AllRows][Salary] ) in
        #table(
            { "Min Salary", "Median Salary", "Max Salary" },
            {
                {
                    List.Min( lSalary ),
                    List.Median( lSalary ),
                    List.Max( lSalary )
                }
            }
        )
    )[[Category], [Job Title], [Temp]],
    ExpandTemp = Table.ExpandTableColumn(AddAll, "Temp", {"Min Salary", "Median Salary", "Max Salary"}, {"Min Salary", "Median Salary", "Max Salary"})
in
    ExpandTemp
.
.
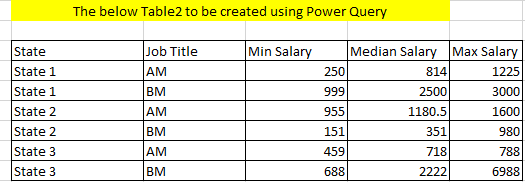
let
Source = Table.FromRows(Json.Document(Binary.Decompress(Binary.FromText("jdS7bsMwDIXhVyk8ZyApUZcx3Tt1DDJ06JYx748KLpDW+Q+KekiM5AMpXuzLZYu2nbb3+8f909fN69v68DRbX+fb7WX/Y7uelut0JZJuwIWKVyrcnJMs/xmOZRRTjmVEHwPO/Lc77+Xa/uOTq3AzmdY6WHM2zyZYiGjOaB5qFsmsnbXGo9b46TFLjQArihUwF6wMsDnEvCZYVf09nO27I02M3xpdVW7QqbVz5lVb7IUsOS9PsibY5OHUmoTRrYvFPk5X/nzGLOli34qn8xlcWRedw3mqtlS4Jh5ZbwyndsUHw00RL5jWewo3WW42sfGHtuzjUG+e4mAtxYsxwKpihUl7P7LrFw==", BinaryEncoding.Base64), Compression.Deflate)), let _t = ((type nullable text) meta [Serialized.Text = true]) in type table [#"Empl ID" = _t, State = _t, #"Job Title" = _t, Salary = _t, Category = _t]),
ChType = Table.TransformColumnTypes(Source,{{"Empl ID", Int64.Type}, {"State", type text}, {"Job Title", type text}, {"Salary", Int64.Type}, {"Category", type text}}),
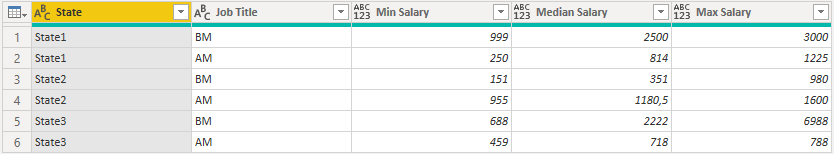
GroupState = Table.Group(ChType, {"State", "Job Title"}, {{"AllRows", each _, type table [Empl ID=nullable number, State=nullable text, Job Title=nullable text, Salary=nullable number, Category=nullable text]}}),
AddAll = Table.AddColumn( GroupState, "Temp", each
let lSalary = List.Buffer( [AllRows][Salary] ) in
#table(
{ "Min Salary", "Median Salary", "Max Salary" },
{
{
List.Min( lSalary ),
List.Median( lSalary ),
List.Max( lSalary )
}
}
)
)[[State], [Job Title], [Temp]],
ExpandTemp = Table.ExpandTableColumn(AddAll, "Temp", {"Min Salary", "Median Salary", "Max Salary"}, {"Min Salary", "Median Salary", "Max Salary"})
in
ExpandTemp
.
.
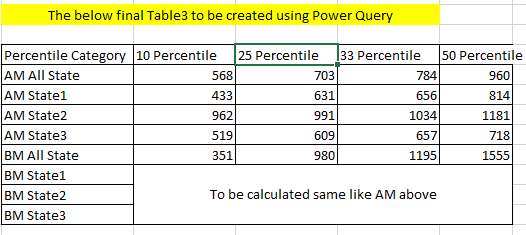
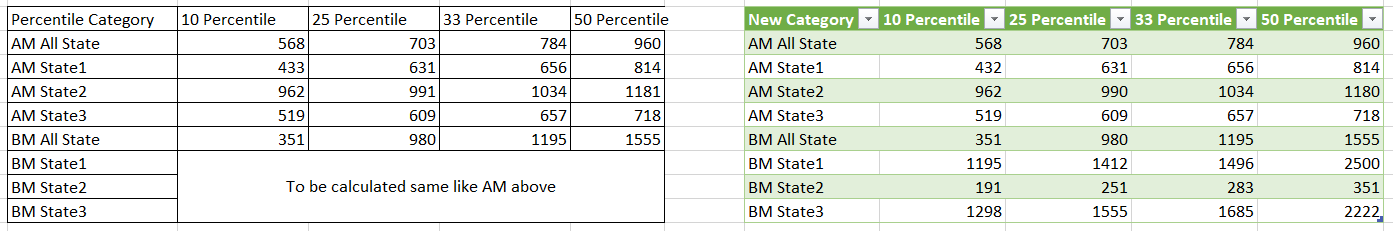
let
Source = Table.FromRows(Json.Document(Binary.Decompress(Binary.FromText("jdS7bsMwDIXhVyk8ZyApUZcx3Tt1DDJ06JYx748KLpDW+Q+KekiM5AMpXuzLZYu2nbb3+8f909fN69v68DRbX+fb7WX/Y7uelut0JZJuwIWKVyrcnJMs/xmOZRRTjmVEHwPO/Lc77+Xa/uOTq3AzmdY6WHM2zyZYiGjOaB5qFsmsnbXGo9b46TFLjQArihUwF6wMsDnEvCZYVf09nO27I02M3xpdVW7QqbVz5lVb7IUsOS9PsibY5OHUmoTRrYvFPk5X/nzGLOli34qn8xlcWRedw3mqtlS4Jh5ZbwyndsUHw00RL5jWewo3WW42sfGHtuzjUG+e4mAtxYsxwKpihUl7P7LrFw==", BinaryEncoding.Base64), Compression.Deflate)), let _t = ((type nullable text) meta [Serialized.Text = true]) in type table [#"Empl ID" = _t, State = _t, #"Job Title" = _t, Salary = _t, Category = _t]),
ChType = Table.TransformColumnTypes(Source,{{"Empl ID", Int64.Type}, {"State", type text}, {"Job Title", type text}, {"Salary", Int64.Type}, {"Category", type text}}),
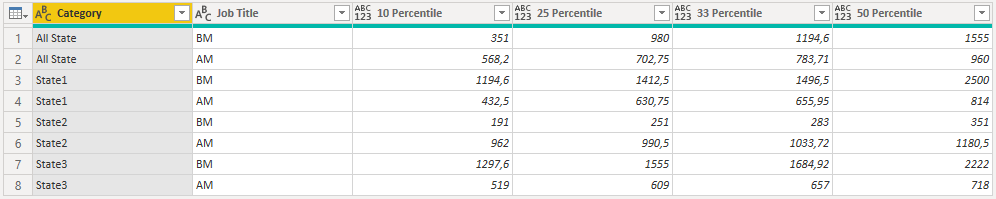
GroupAll = Table.Group(ChType, {"Category", "Job Title"}, {{"AllRows", each _, type table [Empl ID=nullable number, State=nullable text, Job Title=nullable text, Salary=nullable number, Category=nullable text]}}),
GroupState = Table.RenameColumns( Table.Group(ChType, {"State", "Job Title"}, {{"AllRows", each _, type table [Empl ID=nullable number, State=nullable text, Job Title=nullable text, Salary=nullable number, Category=nullable text]}}), {"State", "Category"}),
NewTable = Table.Combine( { GroupAll, GroupState } ),
AddAll = Table.AddColumn( NewTable, "Temp", each
let lSalary = List.Buffer( [AllRows][Salary] ) in
#table(
{ "10 Percentile", "25 Percentile", "33 Percentile", "50 Percentile" },
{
{
List.Percentile( lSalary, 0.10 ),
List.Percentile( lSalary, 0.25 ),
List.Percentile( lSalary, 0.33 ),
List.Percentile( lSalary, 0.50 )
}
}
)
)[[Category], [Job Title], [Temp]],
ExpandTemp = Table.ExpandTableColumn(AddAll, "Temp", {"10 Percentile", "25 Percentile", "33 Percentile", "50 Percentile"}, {"10 Percentile", "25 Percentile", "33 Percentile", "50 Percentile"})
in
ExpandTemp
.