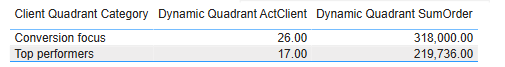
I’m currently in the process of converting Tableau reports to Power BI and have encountered a challenge with replicating a specific calculation. I successfully reproduced the logic in Power BI using a SWITCH statement, which I’ve named Client Quadrant Measure, and it returns the expected results.
However, I’m unsure whether the original Tableau field behaves more like a calculated column or a measure in Power BI terms. Since this is my first time working with Tableau, I examined the field properties and found the following details:
- Discrete Dimension
- Type: Calculated Field
- Contains NULL: Unknown
- Sort flags: Case-sensitive
- Status: Valid
In an attempt to mimic this behavior, I tried adding the Client Quadrant logic as a calculated column to the Order table in Power BI. I realize this approach is generally discouraged—especially when the logic depends on measures or filters—plus it resulted in an error: “Not enough memory”.
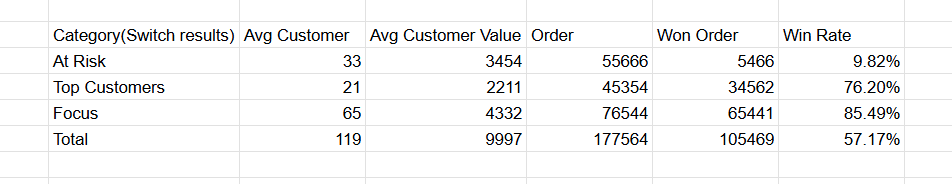
What I’m ultimately trying to achieve is a dynamic summarized table that includes the Client Quadrant as a grouping and the ability to use various fields to slide the summarized table, with accompanying measures like ‘Active,’ ‘Revenue,’ and ‘Win Rate $’ calculated per quadrant.
Attached is the pbix and excel files.
Has anyone faced a similar scenario when migrating from Tableau to Power BI? How did you approach dimensional fields that originate from Tableau’s calculated discrete dimensions? Any advice on best practices for structuring such logic to maintain interactivity and performance in Power BI would be greatly appreciated.
3000_records.csv (252.6 KB)
3000 records.pbix (518.9 KB)