Need Count of Index here at a point in time for July 8 and July 9 Separately.xlsx (19.6 KB)
I have some data here. I want to count the number of records if they fall under startdatetime and enddatetime at a given hour.
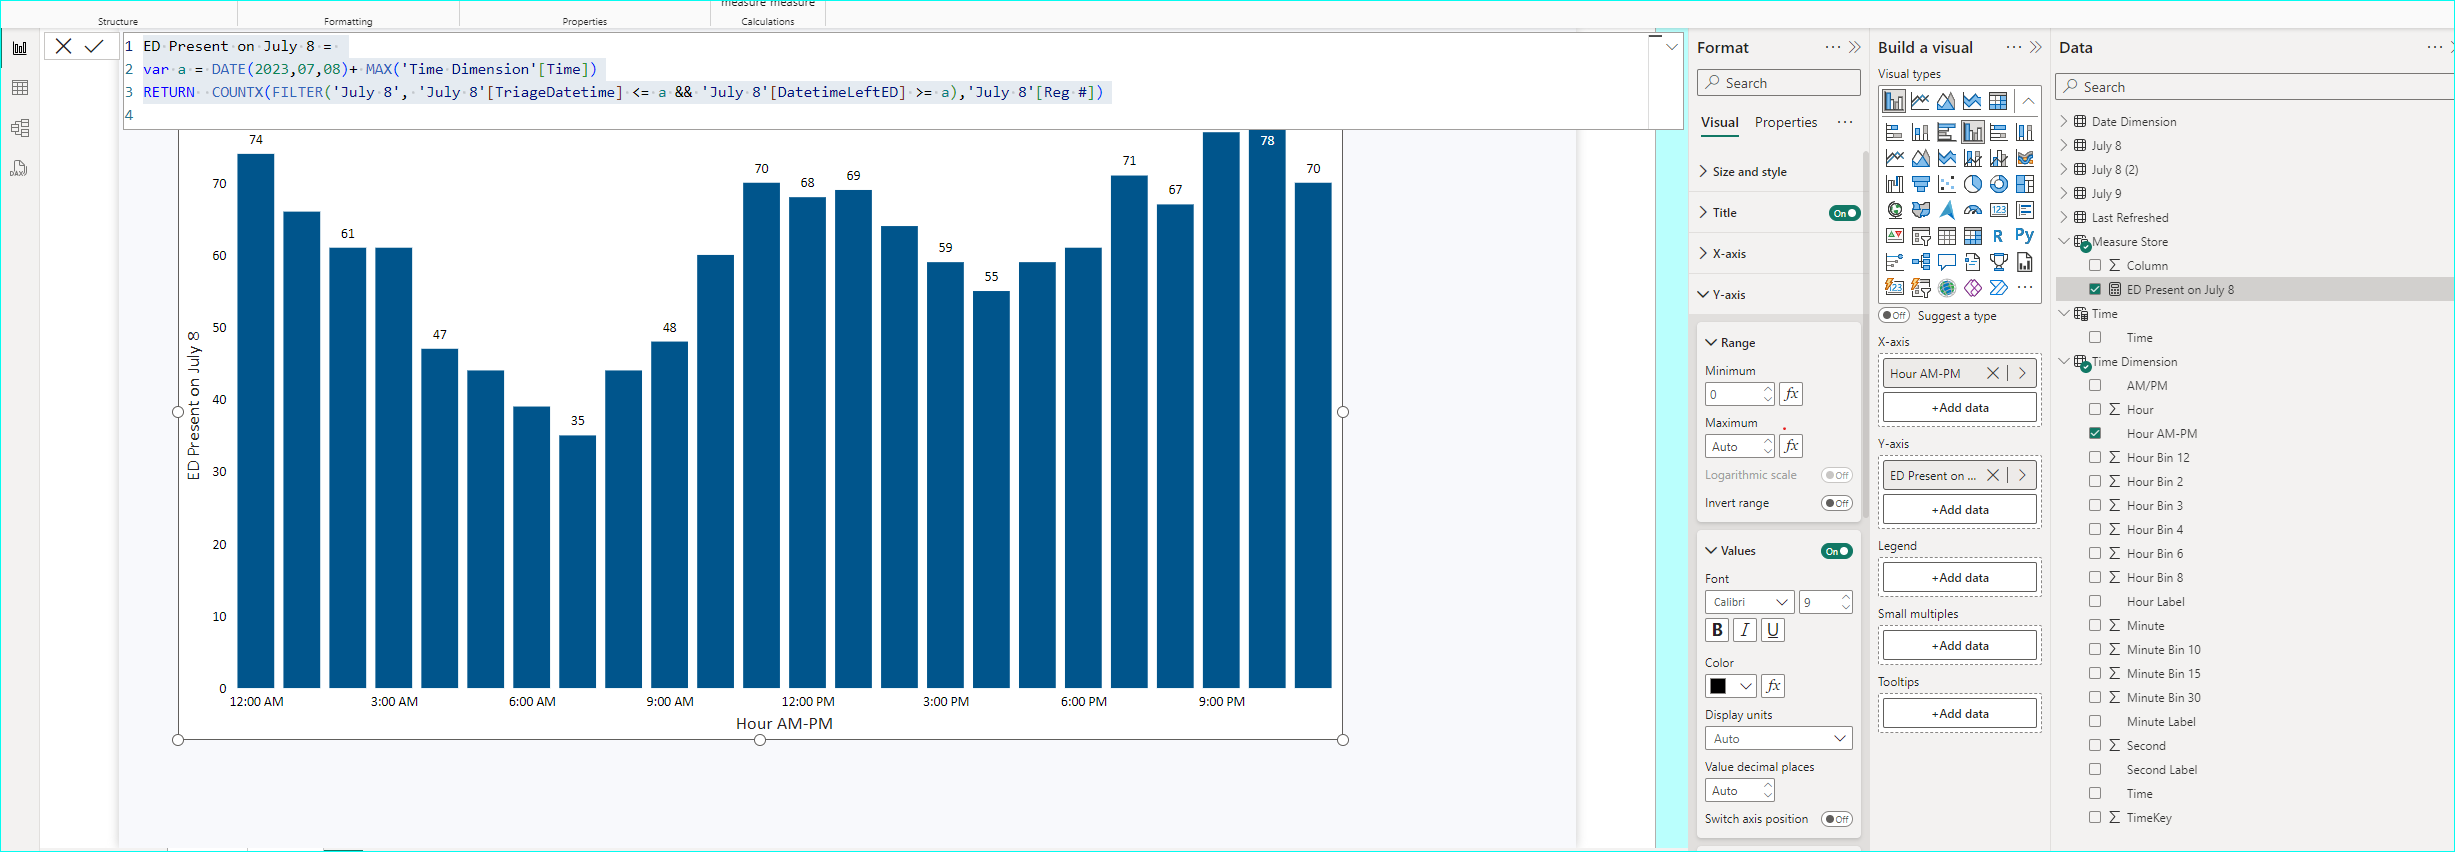
based on the data, I am specifically looking for an Hourly breakdown for July 8 and July 9 here.
I tried to use Countx and Filter to give me active count. But not getting any luck.
Any help would be appreciated. I have attached the mock data here.
I already have a Date table and a time table (with minute level grain). I have build relationships as 1.Start date (I excluded date from stratdatetime) to date
2. Start time ( I extracted from end datetime) to time