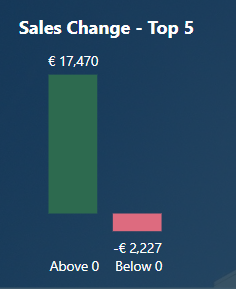
Does anyone know if multiple tooltips on a single bar chart visual is possible? I have a graph put sales into two buckets, above zero and below zero.
The problem that is the tool tip is sorted by value. The above zero shows values descending from the highest to lowest. But when you view below zero, because of the sorting, it starts off with the smallest losses instead of the largest.
I am wondering if it is even possible to have one tool tip for above zero and another for below zero. Or if there is some sort of dynamic sorting option.
@jsodhi - Hi Japjeet, thank you for the feedback. I checked out the link and unfortunately it did not cover the topic of multiple tool tips for a single visual. Are you aware of any other sources for this information?