Hello all!
Sorry I keep having questions…
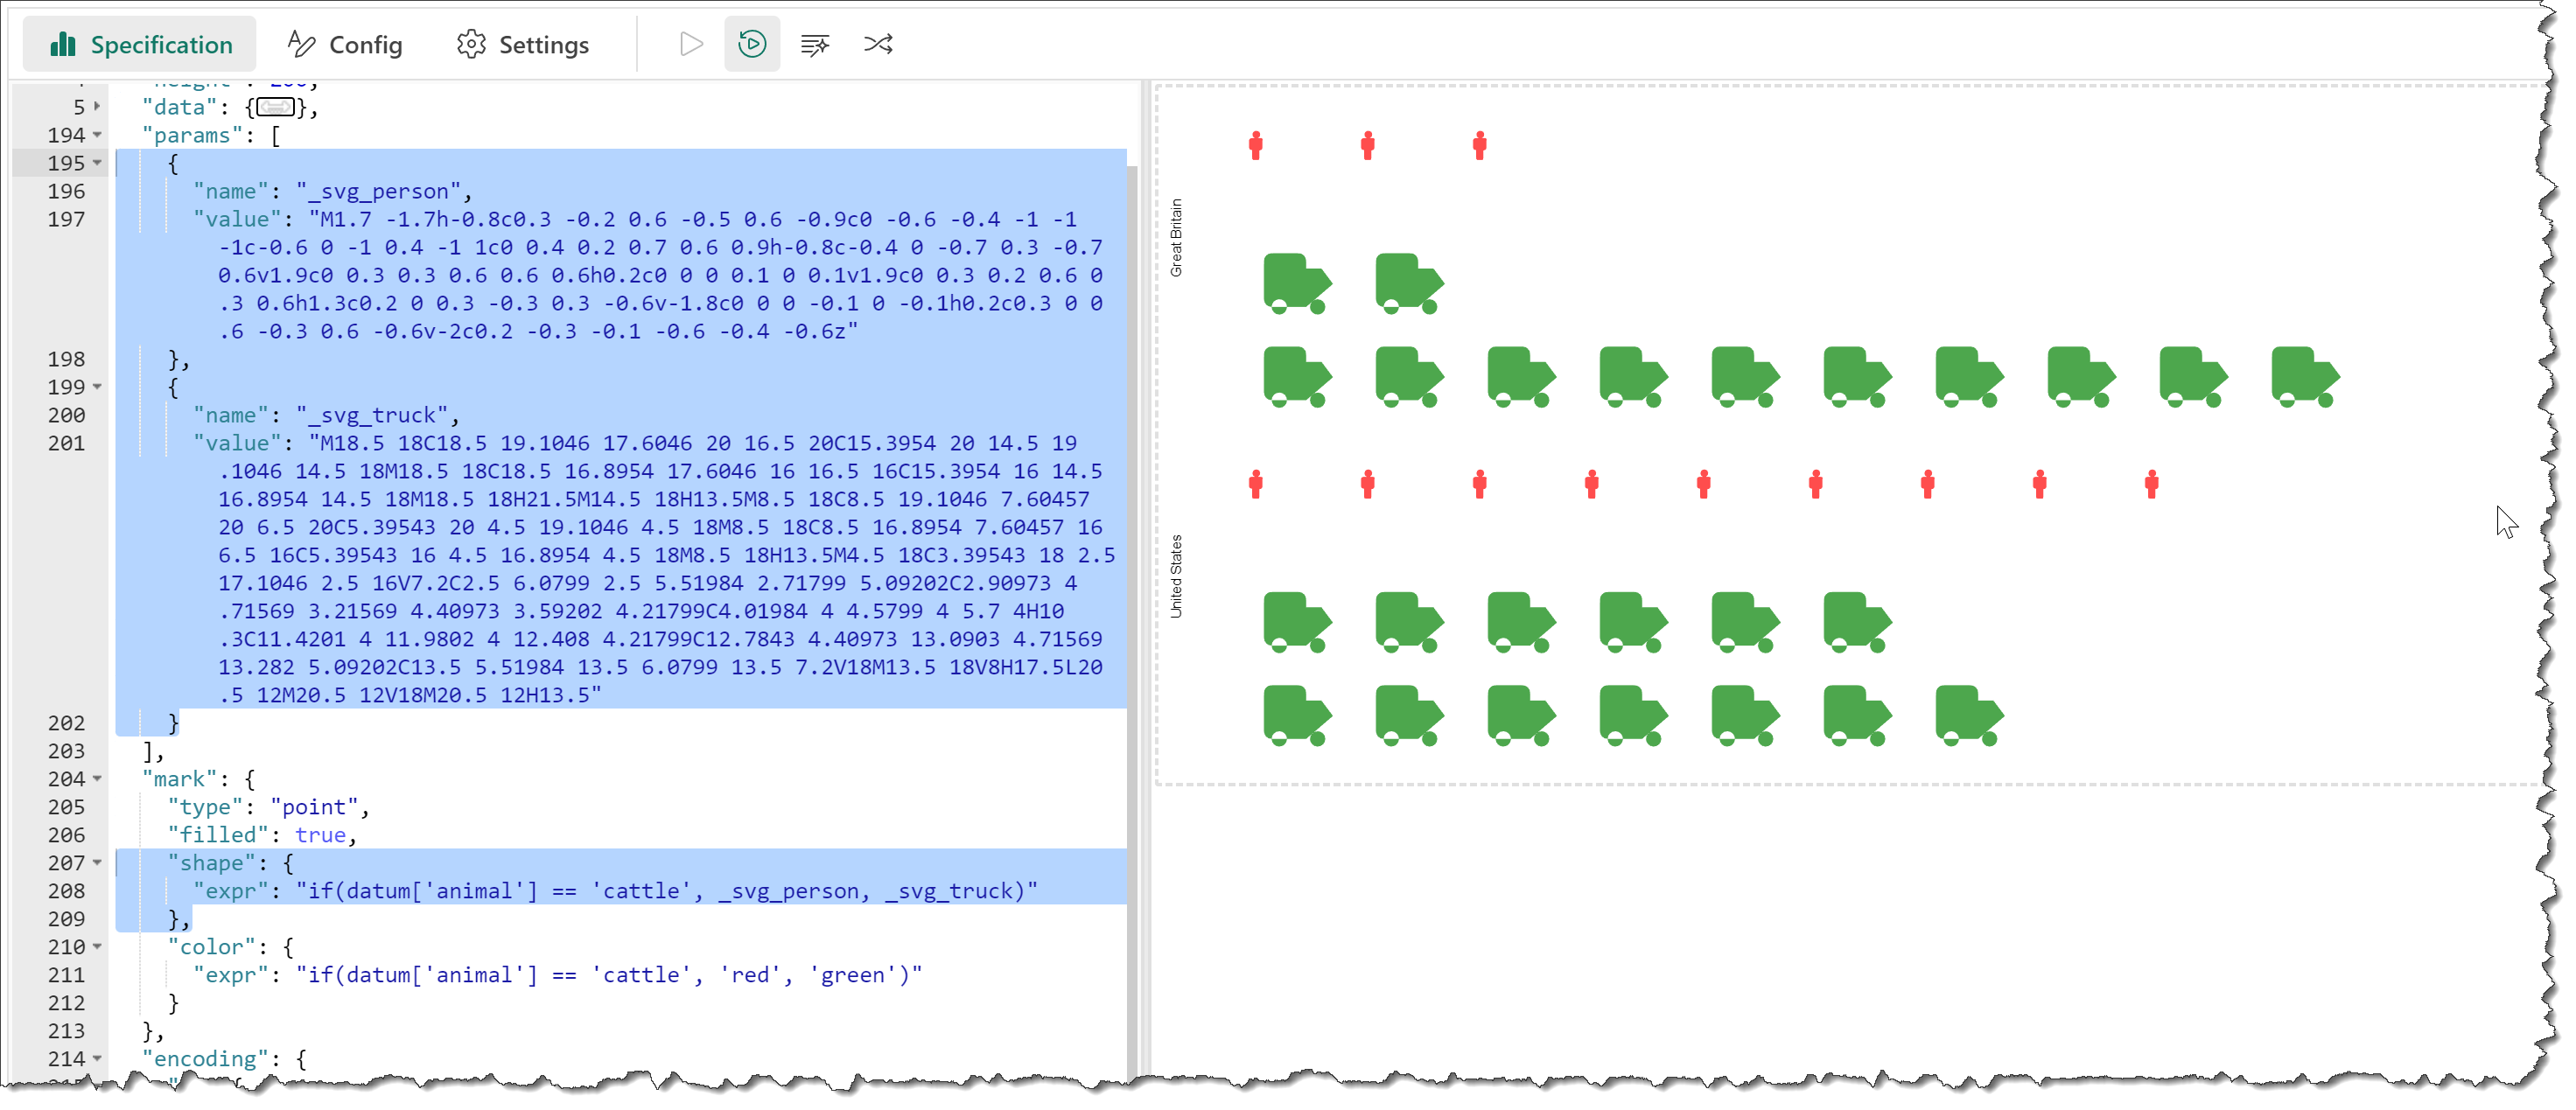
I wanted to use an SVG image as a “point” mark shape as per Vega-Lite tutorial:
Shape of the point marks. Supported values include:
[…]
*** a custom SVG path string (For correct sizing, custom shape paths should be defined within a square bounding box with coordinates ranging from -1 to 1 along both the x and y dimensions.)**
However, in all examples I found one path only is specified for the svg image, whereas mine contains more “paths” - see the attached PowerBI, it is the “# SVG Tutorial Icon” measure containing the SVG paths forming the finished image.
Is this possible at all? It’s for a workaround for an idea I have - if it works out I will post about it.
Hi @valeriabreveglieri. Is this the correct PBIX? I see the same data and visual in the supplied PBIX as in the Isotype Dot Plot example, and while I see your Power BI measure [# SVG Tutorial Icon], I don’t see what you’re desired outcome is: are you looking to have only the single SVG (from the measure) used in all cases?
(Never used SVGs before, so wanted to get things straight in my mind before embarking … can you prepare a mock-up of your desired result?)
Hello @Greg !
Yes I used the same file as last time, as I needed some underlying data that do not show but you should see a chart with the Vega-lite shape ex (animals?). I hope this version is OK…
The idea is to replace the cow/pig/… svgs in the vega-lite graph example on the page with the “tutorial” icon that I have now rendered in a matrix to make it clearer. Yes I would only need the “Tutorial” SVG in the end, not the animals SVGs, but once understood how to pass it to Vega-lite, then remodeling the chart should be easy (note the conditional )
So practically change the code in the Vega-lite example for at least one svg path to render the shape of the points as my “tutorial” svg.
The difficulty I am finding is that my svg has several paths - it is several components together - not just one like the examples from Vega-lite. So I am not sure if possible/how to pass that on…
Hope it’s clearer - if not please let me know!
Thanks
Kind regards
Valeria
If your need is just to use a simple SVG code within the visual, this should suffice. Your “tutorial” code from your Power BI measure looks more complex (it has several “path” sections); not sure of the syntax to add it within the Vega-Lite JSON code, nor if you need to send this from a measure, but in any event, I hope this helps.
Thank you @Greg ! I had not seen the video by Ben Ferry - it is really good with a lot of resources
Now I have not seen any comments out there about the possibility to use more complex SVGs with several paths… the curiosity still remains but I am pretty sure now I will be able to find a simpler SVG icon to do the job among the over 26,000 from Free Icons | Font Awesome (the SVG resources that Ben Ferry suggested) or from what you are also using SVG Repo - Free SVG Vectors and Icons!