I am looking for a summary table, four column wide, which is a combination of text and three measures per line in the table.
The idea is that it would be possible to drag and drop the measures in each individual line in the table, is this somewhere possible in Power BI ?
Example structure with 15 measures:
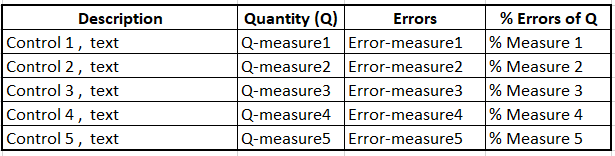
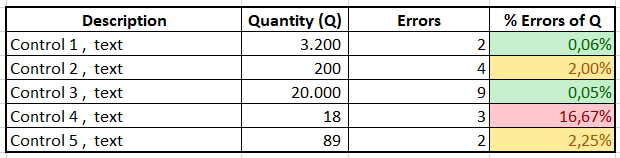
Same example with 15 measure outcomes
(Metrics or smart narratives do not really meet my requirements in the drag and drop wish)
Thank you very much in advance for any suggestion !
A solution / workaround for multiple measures in a table is setting up a (summary) table, whereby the individual measures are collected in the rows of calculated column(s), with the switch( true()) function.
See attached PBIX :
Multiple measures in a table.pbix (28.2 KB)
Example of a calculated column:
Errors = SWITCH( TRUE(),
[Description]=“Control1”,[Error1],
[Description]=“Control2”,[Error2],
[Description]=“Control3”,[Error3],
[Description]=“Control4”,[Error4],
[Description]=“Control5”,[Error5],
0)
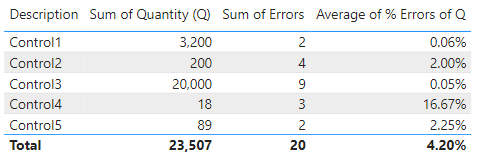
Resulting in an example table, containing 10 measures:
It is NOT recommended to add lots of measures to a summary table, as it heavily impacts performance , adjusting measures then takes a long time. However presenting and filtering the table after the measures in the calculated column are calculated works fine (500 measures in 2 calculated columns still works. . . ) , so it probably could work in a non-dynamic environment. Alternatively the calculated columns can be turned off temporary by pressing “CRTL /” when adjusting measures.