I hope to build a trend graph of running hours/mileage etc over time & have a tried a few ways in Dax from Sam’s lessons. But not quite at that level yet to know the Dax functions enough to filter this down.
Per the attached Pbix, I have multiple Components per Asset I need to filter out for each running hour. Each entry may be daily with some weekly or monthly, so need to find the previous entry according to the Asset & Component.
Would I be right in setting up a number of measures to filter first, then subtract Today from Earlier? I have this in another Data model, with Assets as a Lookup table also if that matters.
Similar to vehicle miles or temperature entries to show a trend of utilisation.
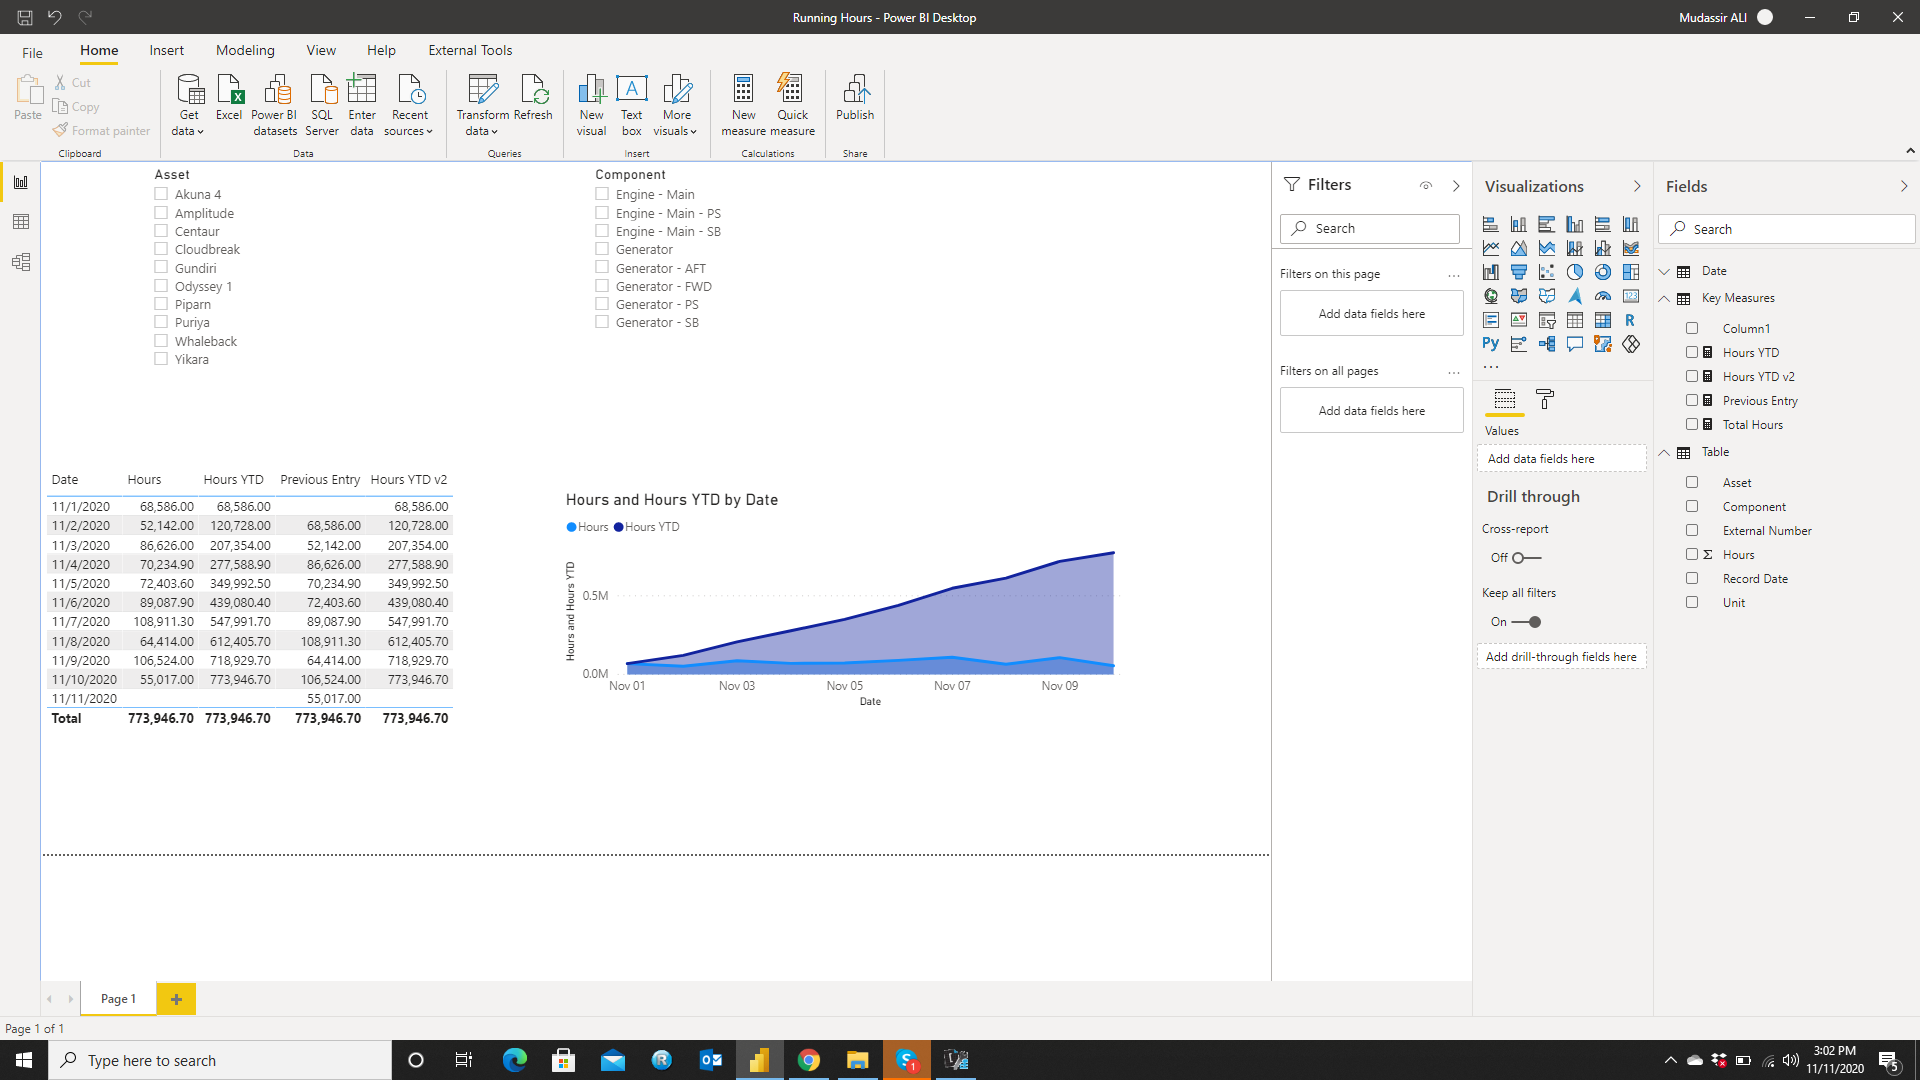
I tried the following measure and it gives the running hours that are filtered by Assets & Components.
Hours YTD =
VAR MaxDate =
    MAX ( 'Table'[Record Date] )
VAR CurrentDate =
    SELECTEDVALUE ( 'Date'[Date] )
VAR Result =
    IF (
        CurrentDate > MaxDate,
              BLANK (),
                CALCULATE ( [Total Hours], DATESYTD ( 'Date'[Date] ) )
    )
RETURN
    Result
The running hours weren’t working in your case because you didn’t have a continuous Date Table. So, I added one prepared by @ Melissa which we use now for almost every report
I should have had the date table linked which I do in the master file, thanks for including one.
The hours entries are the total component hours in themselves, which is one metric.
The other is being able to break down how many hours the Assets are completing in each period filtered. Being able to spot peak utilisation or spikes in usage over other Assets etc.
I think I can use your work as a guide here, changing the Total hours measure to last hours entry, then the Previous Entry find the last entry. This one may not work as is, due to not always being an entry the day before. Hence trying Earlier
I’ll give this a go today & let you know how I go. Thank you for the guidance!
Hi @drew, did the response provided by @MudassirAli help you solve your query? If not, how far did you get, and what kind of help you need further? If yes, kindly mark the thread as solved. Thanks!
I tried multiple ideas for the solution, but came up blanks.
The scope I need to achieve is a measure or calculated column of the amount of hours between entries. ie. latest entry vs last entry (Varied dates). This must be able to be filtered down by Asset & individual component on each asset, which is where I struggled to filter 2 columns of Asset & Components.
The end goal is to be able to show hours/mileage per day/week over the year. ie, the Asset was used a lot the last 3 weeks but nothing this week. Which allows for visibility of issues on utilisation.
One of Sam’s videos gave some good insight along with Guy in a cube, but I’m still learning how to piece together Dax for best efficiency & function.