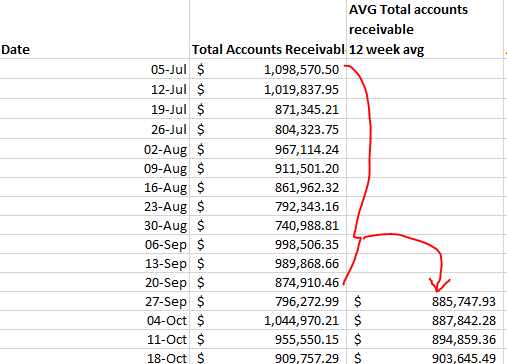
Hi awesome community. I have a visual that displays a table with a “Week Ending Tuesday” column as a date and a DAX measure for “Total Accounts Receivable”. I need to create a new DAX measure that calculates the 12-week average of the “Total Accounts Receivable” measure. Consider the date filter of financial year that starts in July. End goal will be same as the table below. Thanks in advance
Hello @ankit, I appreciate your effort. However, the solution you provided only works for your scenario where you have an index on your date table. Unfortunately, I don’t have an index on my date table, and my “Week Ending of Tuesday” column has a format of dd-mmm. This makes it difficult for me to index the column while considering a financial year that starts in July.
I hope this message finds you well. I understand that you are working with sensitive information and are unable to share it in the forum. We respect your privacy and appreciate your caution.
In order for our experts and members to assist you with your inquiry, it would be helpful if you could provide sample data that is not sensitive or confidential. If that is not possible, please let us know so we can explore other options.
In the meantime, you may want to check out the thread we recommended earlier, which might help you with masking your pbix file. How To Mask Sensitive Data
Please don’t hesitate to let us know if you have any questions or if there is anything else we can do to help.
@ankit@EnterpriseDNA , please find attached sample pbix file. What I did was to create the dates table and connected it with your example. Thanks in advance.
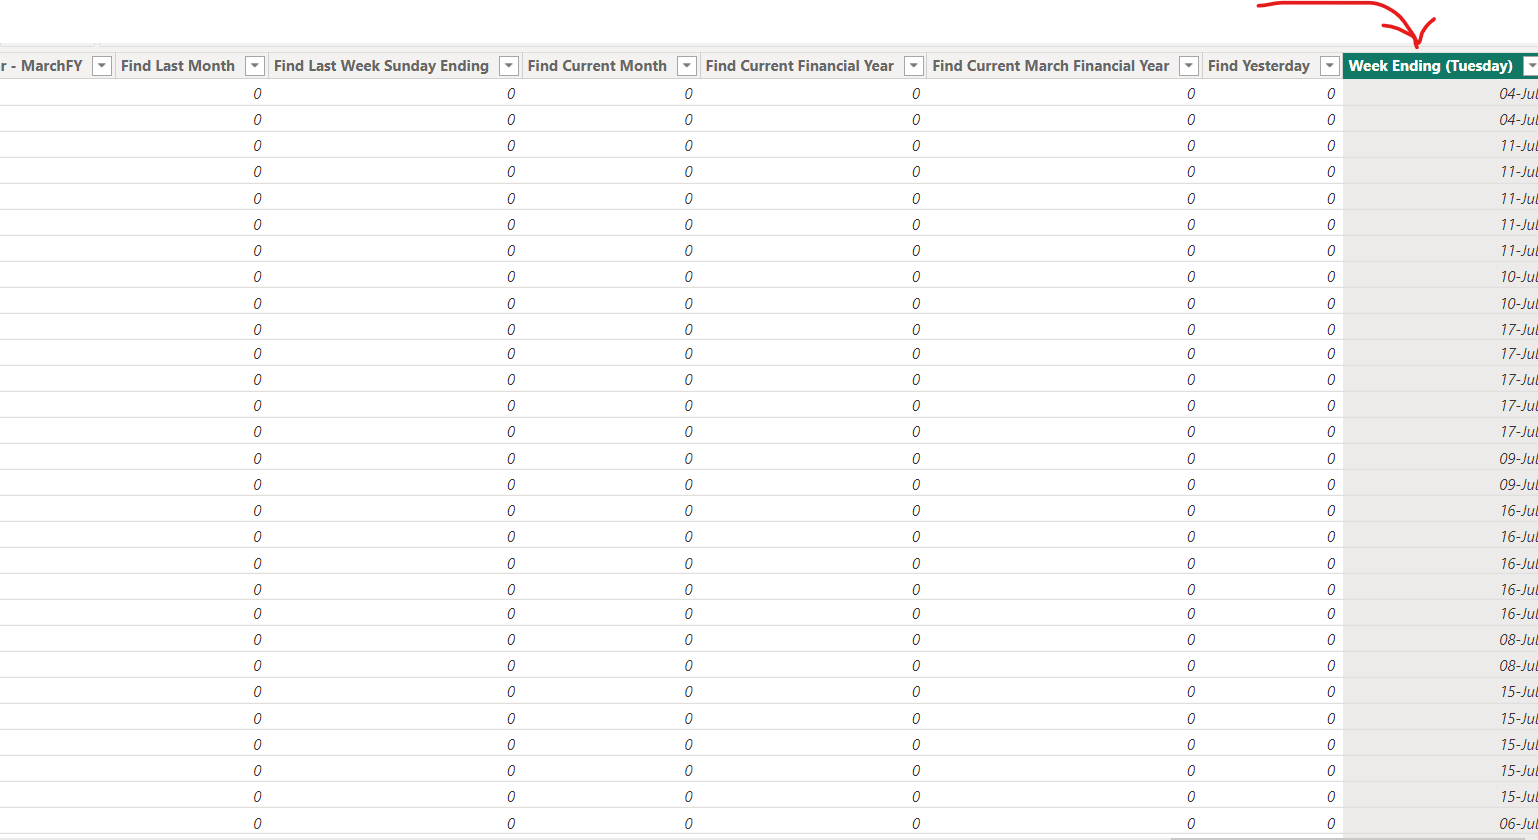
Hi @ronald_balza - I have added Financial week number in Date table. You can use that as Index for reporting. Please check NewDate table. Let me know if further help is needed.