Monthly sales showing X2 for particular month

Fellow Power BI Users -

Analyzing the sales data in Power BI.

For 2 months sales (Jul 17 & Aug 17) sales shown in the Power BI report is not correct. It is actually showing twice the sales.

For Jul 18 the sales data is not shown in the report even though the data is available in the query editor

I have attached the PBI file.

SalesPerformance.pbix (2.5 MB)

Can you help?

Ok let’s break this down and audit the numbers.

This should be what you should aim to do when you run into problems like this.

One thing to note is that Power BI is basically never wrong with it’s calculations so it’s likely an issue with your data or some relationship you have created.

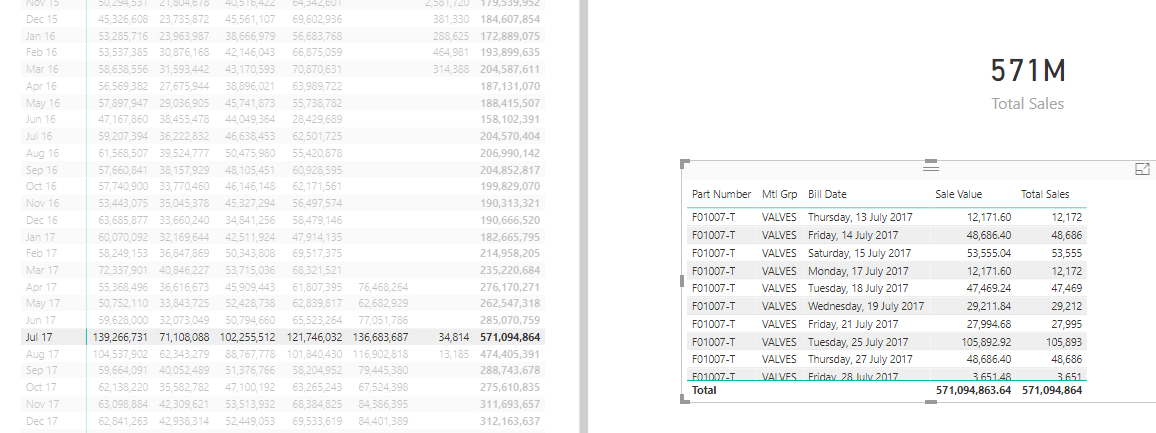
To audit the data should be easy.

I’ve just taken columns from the sales table and brought them into a new table.

All I can tell you is that this is what you data is showing. So that’s the problem. Your data must be incorrect.

You’ll likely need to look into that further.

Sam

I double checked the data and corrected the data.

Thanks Sam.