Hi Team,
I am working on a report which is expected to provide both daily and monthly insights on the same page. I have set a page level filter on today’s date. So all my visuals are filtered for current date when the report is loaded. Now I also need to show some monthly trends like new accounts, created in last month. Following your videos I have come up with the DAX formula.
New Accounts 1M = CALCULATE([New accounts],DATESINPERIOD(DateTable[Date],TODAY(),-1,MONTH),ALL(DateTable[Date]))
But the page level filter still applies and I get just one value for todays date.
Can you please let me know how to get this fixed.
Thanks in advance.
Possible to add some images of what you are seeing here?
You shouldn’t really need this as part of the formula I don’t believe - ALL(DateTable[Date]))
If you want to just work out calculations over different time frames you most likely want to be using the DATEADD function rather than the DATESINPERIOD function.
See here for more information on this.
I’m actually pretty confident this is what you need actually
Sam
Thank you so much for your timely response.
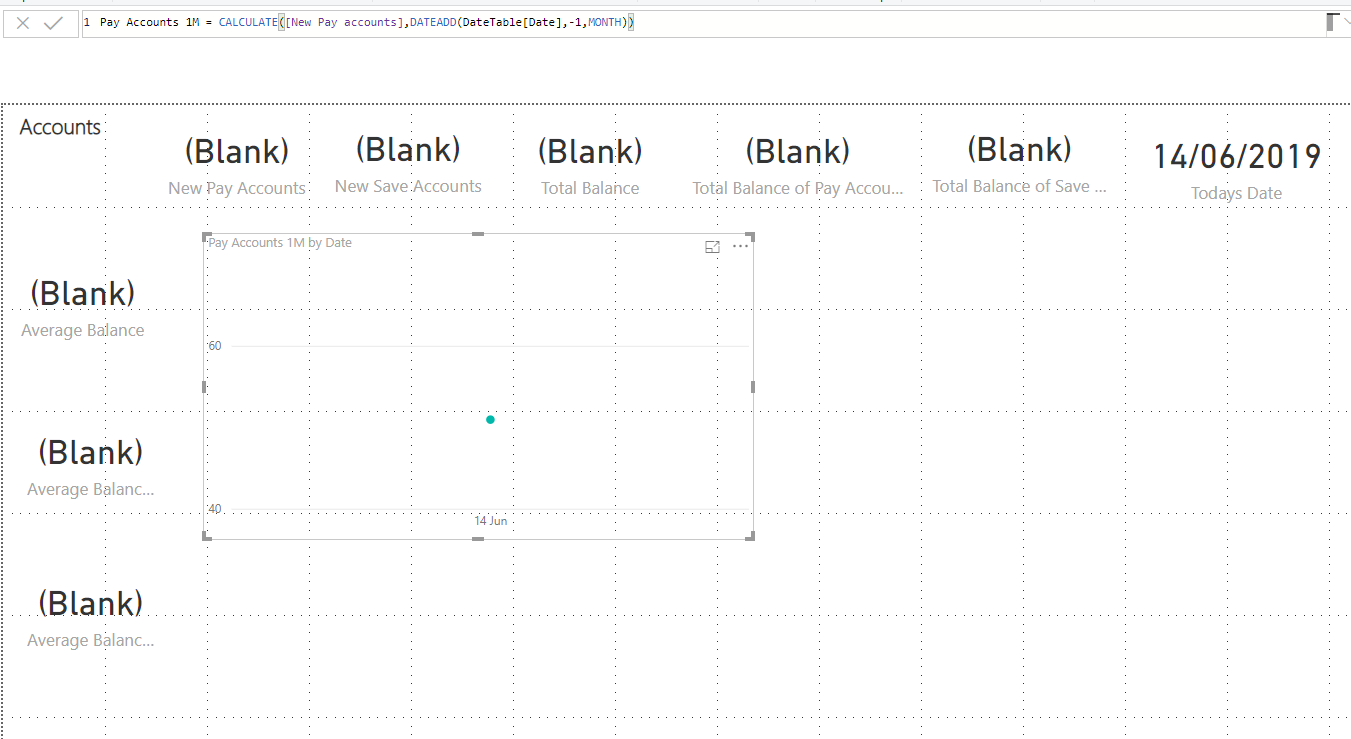
I tried with the DATEADD function but I am still getting a single value for current date. Find attached my report.
What I am trying to achieve here is , I want all my card visuals to reflect values for the current date( which I have set as page filter). For the graph I want to show trend over the past month.
Say my date is 01/06/2019 , the line graph should reflect the values from 01-May-2019 untill 31-May-2019.
If my date is 14/06/2019, I should see values from 13-May-2019 untill 13-Jun-2019.
Thanks again.
I removed the page level filter… So now what I need is a DAX formula which calculates the No of Accounts created in the last 1 month, which I would like to show as a line graph with values for each day. I tried the below but it gets me values for all months in the Accounts table starting from Jan 2018, where as what I am looking to get is just values for past 30 days from current date.
CALCULATE([New accounts],DATEADD(DateTable[Date],-30,DAY))