I’ve got a simply dataset with the number of open projects per month by line of business.
I’m simply trying to show the Total Growth in a card form so that it filters by Line of Business and Fiscal Year. I’ve been able to get the number of projects to work correctly. But the percentage card does not align with the waterfall card. I can’t figure out why?
Well, it’s basically doing the summation of all the months for that particular fiscal year. And to achieve that result below is the measure alongwith the screenshot of the final results provided for the reference -
I’m also attaching the working of the PBIX file as well as providing a link of a video pertaining to the topic - “Fixing Card Visual Results” for reference purposes.
Hoping you find this useful and meets your requirements that you’ve been looking for.
Suming MoM quantity change you end up with YoY project quantity change but summing MoM % change for all months you dot no really end up with YoY change. I think that instead you should compare number of projects from last month of the year to number of projects from last month previous year. I would go with something like this
MoM Change (%) =
VAR _lastMonth =
    LASTDATE ( 'Date Table'[Month & Year] )
VAR Current_Month =
    CALCULATE (
        SUM ( 'Project File'[# of Projects] ),
        FILTER ( 'Date Table', 'Date Table'[Month & Year] = _lastMonth )
    )
VAR Prior_Month =
    CALCULATE (
        SUM ( 'Project File'[# of Projects] ),
        PARALLELPERIOD ( 'Date Table'[Date], -1, MONTH )
    )
VAR _prevFY =
    "FY"
        & RIGHT ( SELECTEDVALUE ( 'Date Table'[Fiscal Year] ), 2 ) - 1
VAR _lastMontPrevYear =
    CALCULATE (
        LASTDATE ( 'Date Table'[Month & Year] ),
        FILTER ( ALL ( 'Date Table' ), 'Date Table'[Fiscal Year] = _prevFY )
    )
VAR _prevYearProjects =
    CALCULATE (
        SUM ( 'Project File'[# of Projects] ),
        FILTER ( ALL ( 'Date Table' ), 'Date Table'[Month & Year] = _lastMontPrevYear )
    )
VAR _prevPeriodProjects =
    IF (
        COUNTROWS ( VALUES ( 'Date Table'[Month & Year] ) ) > 1,
        _prevYearProjects,
        Prior_Month
    )
VAR Percentage_Diff =
    DIVIDE ( ( Current_Month - _prevPeriodProjects ), _prevPeriodProjects, 0 )
RETURN
    Percentage_Diff
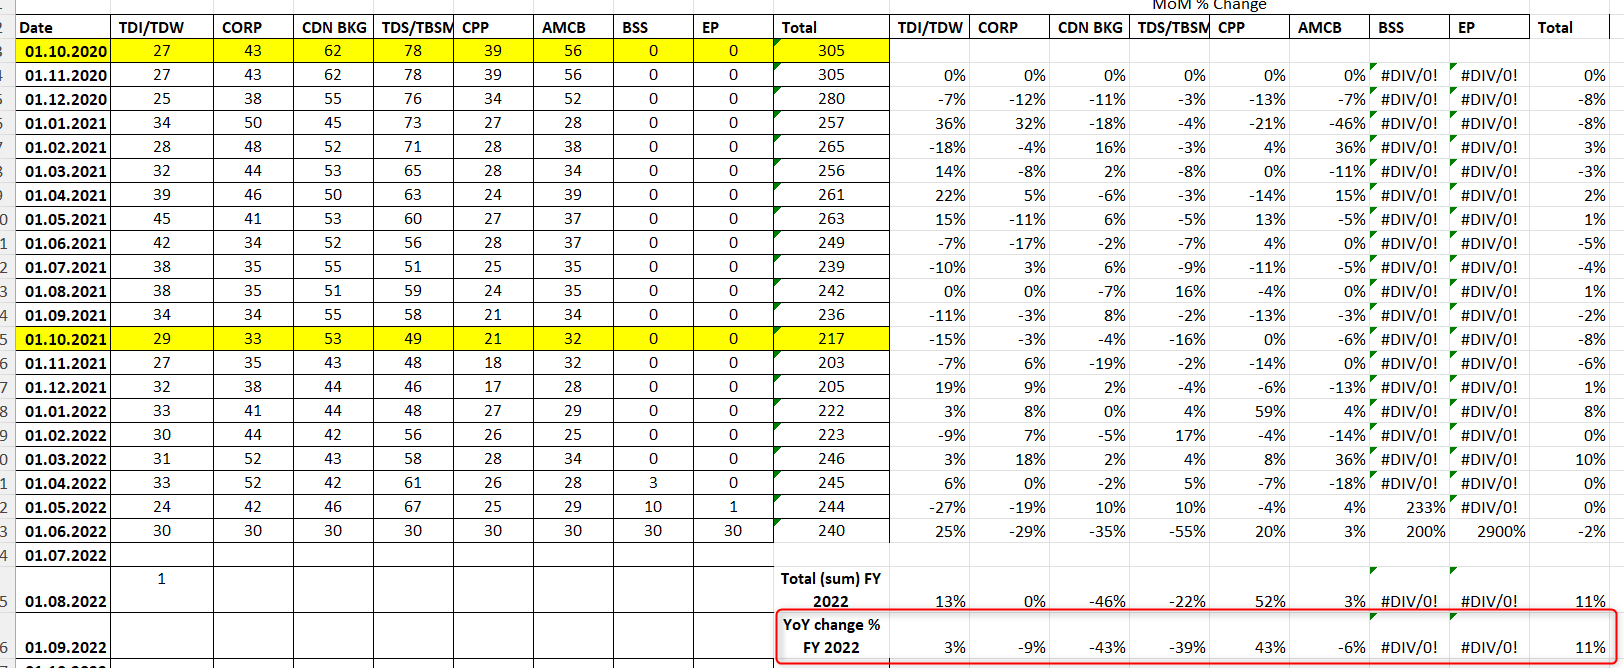
This measure, if you are looking at a single month, is showing you MoM % change, but for the card visual, where entire year is a context, it is comparing project qty from last month CY to last month PY.
I think that one makes more sense in that case. Here is a difference in an excel
You are correct, the SumX doesn’t provide the correct value as compared to the whole number calculation. I would not have noticed this if you hadn’t pointed it out.
Take a look at the second solution that was provided. The sum of the percentages does not give the proper answer. The Sum of the whole numbers work, but not the percentages. I’m going to have to spend some time rethinking this as it’s blowing my mind this early in the AM