Hello,
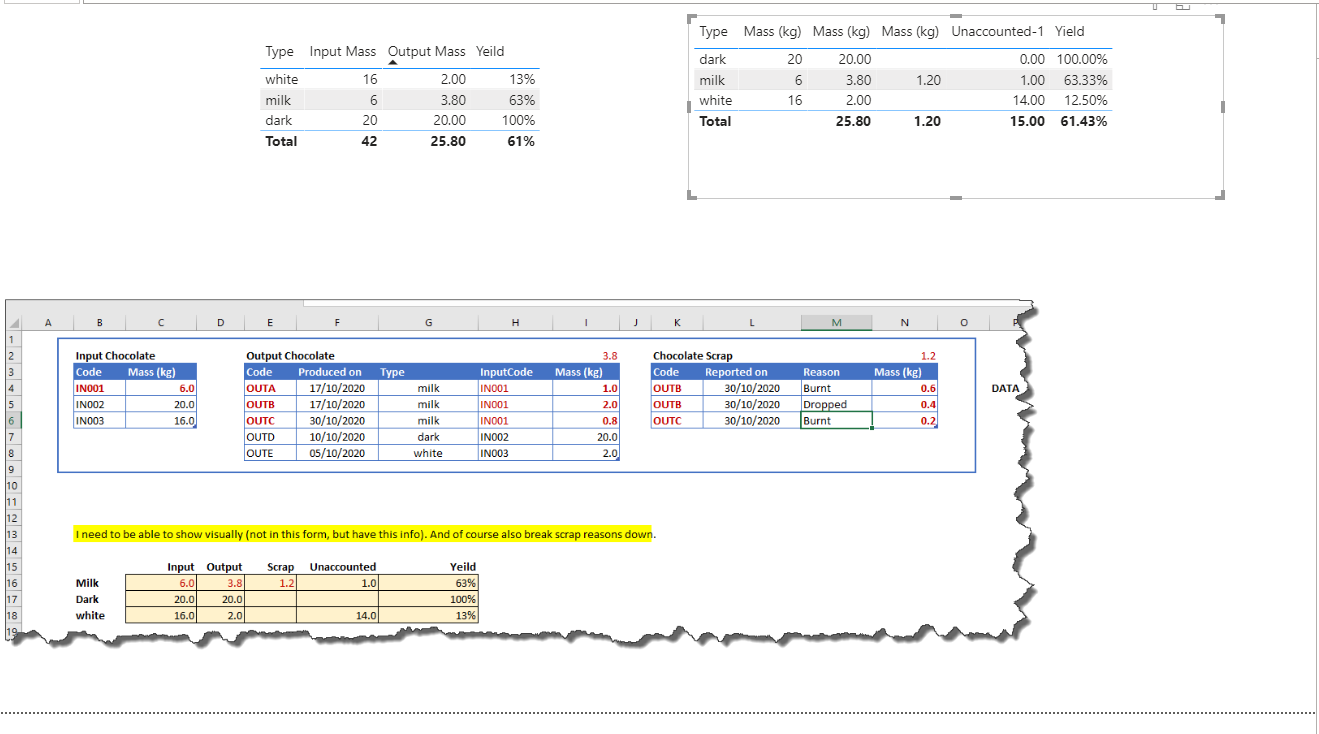
I am calculating chocolate yields over time. The yellow cells below show the kind of measures I need to create.
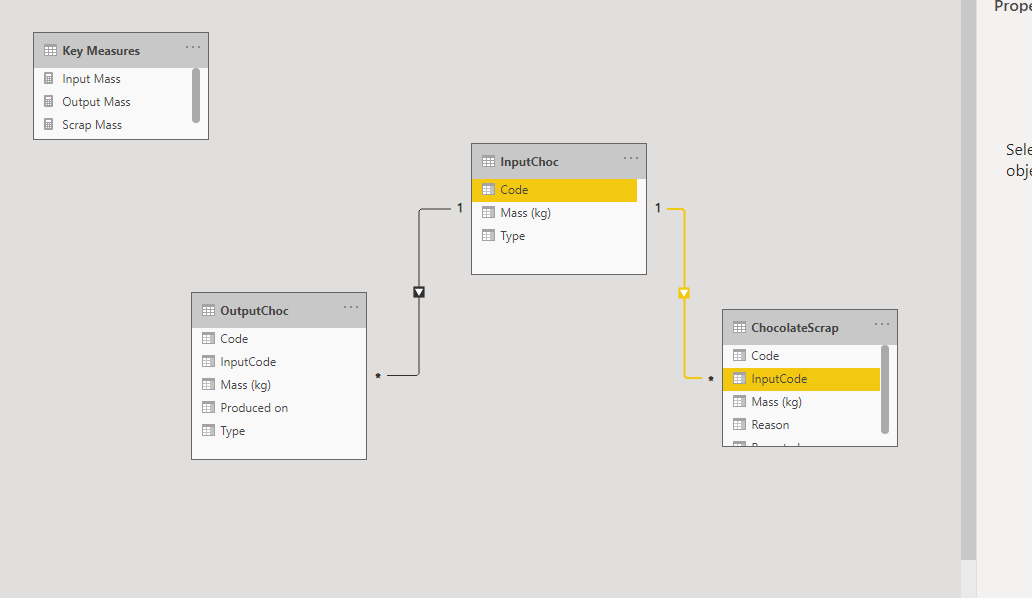
Question: I’ve modelled my data as shown - is this an advisable / feasible way to model my data in order to calculate the results I need? I’ve tried about 5 different attempts. I arrived at this design because it makes sense when I talk about it: One input of chocolate (eg a wheelbarrow) can produce one or more chocolate bars of different kinds. And each chocolate bar can have zero or more reasons to be scrapped. The reason I am also double checking my model is that the dax seems far from simple. It may just be because my dax skills need to be drastically improved. But I’m not 100% sure.
Is this model design, advisable? … is it just that my dax needs, ermm… a lot of work? (pbix and data are here Chocolate Yeilds.zip (84.4 KB) )
As always thank you,
Michelle
Hi @michellepace,
Thanks for posting this question. In order to quickly fix it, I have enabled bidirectional filter and there are other ways to solve it without enabling it by creating bridge table or by enabling cross filter within a measure.
Anyhow, just by enabling cross filter, I could achieve your desired result. I didn’t create measures and you can simply sum to create measures.
Please feel free to get in touch in case of any issue.Chocolate Yeilds.pbix (74.6 KB)
Kind Regards,
Hafiz
1 Like
@michellepace
From the process point of view it looks good like process flowing from input to final product to scrap. The golden rule is to have Many-to-One relationships which you have in this sample dataset. In OUTPUT CHOCOLATE, my question is whether the Code will be unique or not later on. If there will be duplicates then it is better to create a Dim table with Unique codes to avoid bi-directional relationships.
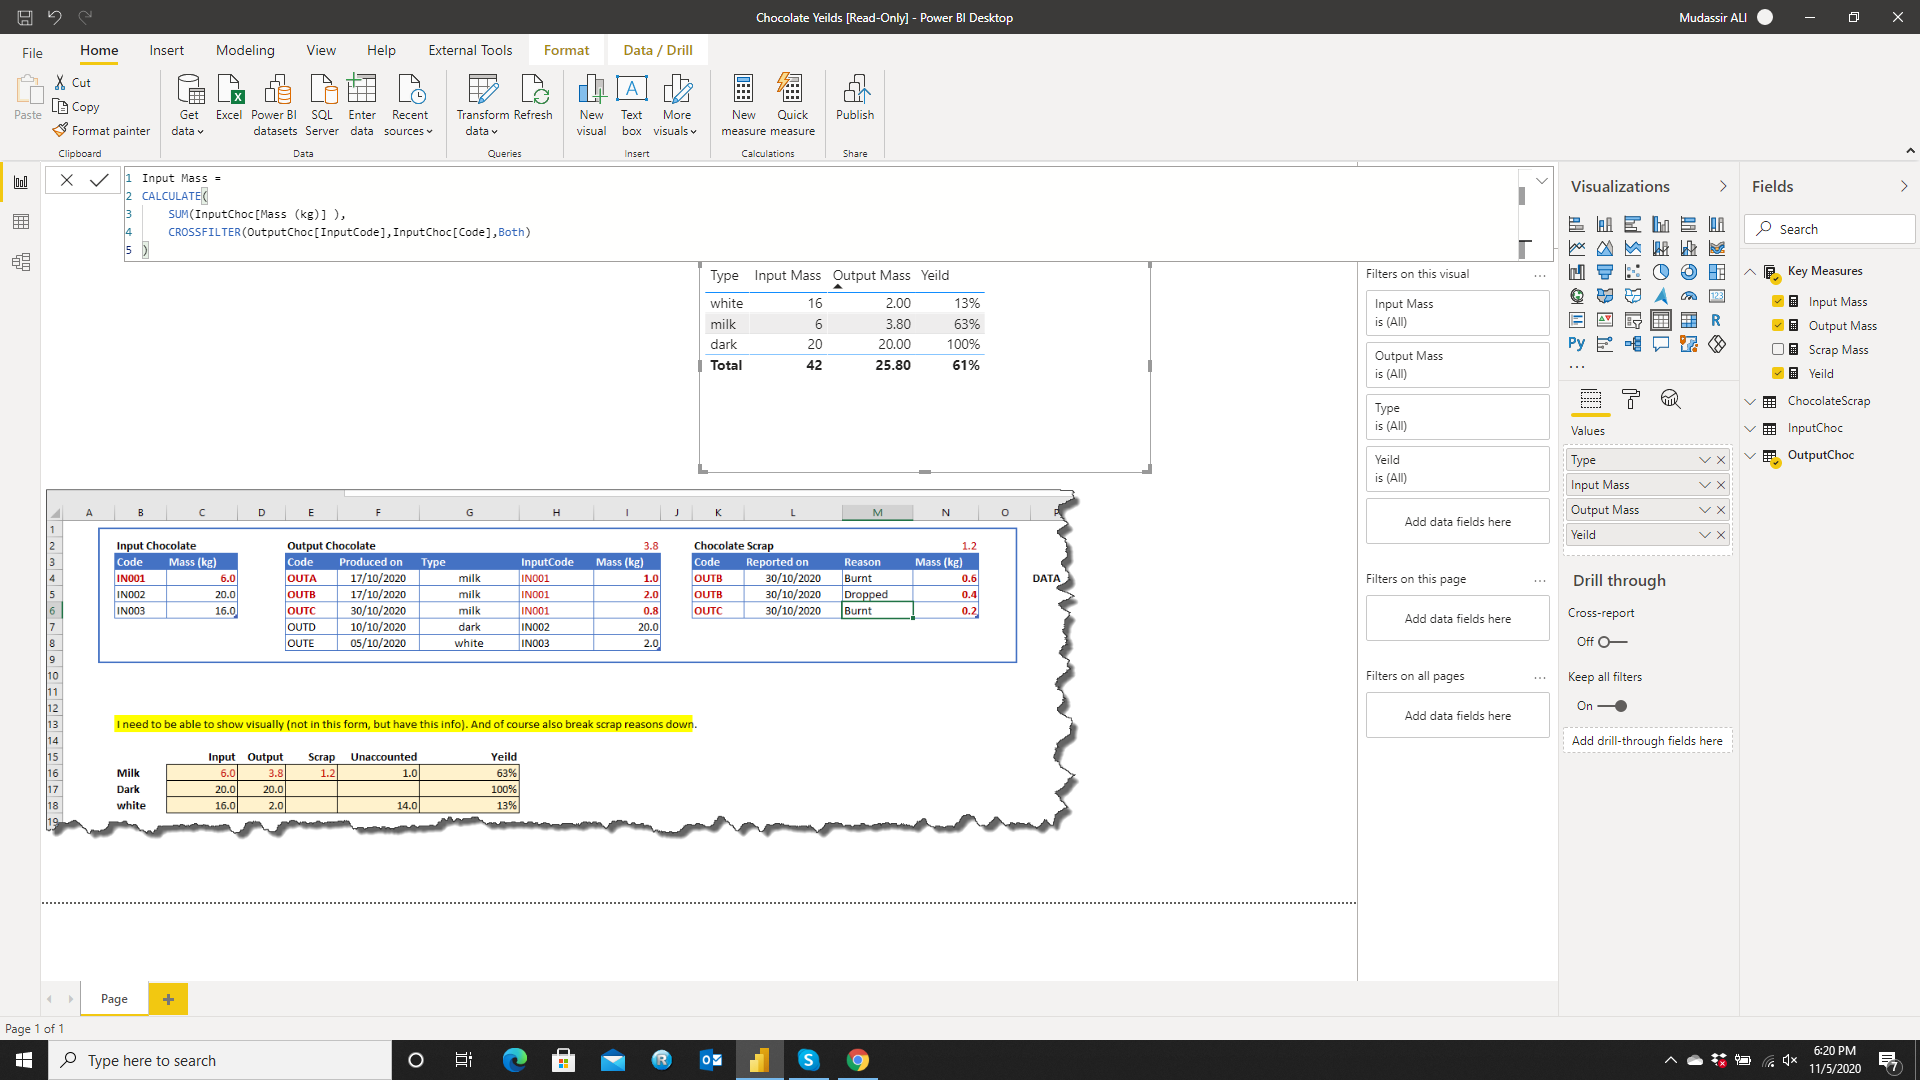
Now seeing the measures it can be seen that Input is showing the same value as the filter is not flowing from Output Table to Input Table. So to get the correct values I used the Cross filter function to activate the filtering from Output to Input.
Input Mass =
CALCULATE (
SUM ( InputChoc[Mass (kg)] ),
CROSSFILTER ( OutputChoc[InputCode], InputChoc[Code], BOTH )
)
What I see is that you will be using Cross filter, Treatas or userelationship function more often.
The best part with creating dashboards in PowerBi is that you can change relationships as you go without getting into complexities unlike Excel.
You can go ahead and can always back to the forum if you face problems and we will be happy to help. You will get to know more when you create DAX expressions along the way.
The following videos seem relevant according to your model:
Lastly your DAX skills are great it’s just that every dataset requires different level of detail that seems daunting in the beginning but you get the hold of it shortly.
Best of Luck for your project!
@michellepace
With a couple of column additions you can reorientate this to get the result you want without changing your existing measures - avoiding bi-directional relationships (which should always be last resort) and complex dax.
add calculated column to table InputChoc
Type = LOOKUPVALUE( OutputChoc[Type], OutputChoc[InputCode], InputChoc[Code] )
add calculated column to table ChocolateScrap
InputCode = LOOKUPVALUE( OutputChoc[InputCode], OutputChoc[Code], ChocolateScrap[Code] )
change the relationships
Ideally the additional calculated columns should come from source or be calculated in PowerQuery instead of calculated as calculated columns.
Chocolate Yeilds.pbix (75.5 KB)
2 Likes