I have questions regarding how you set up your reports. I’d like to preface that I have gone through the classes for best data practices, and I’ve tried sharing this knowledge with management.
Do you have one model that contains everything?
Do you create separate models for different data?
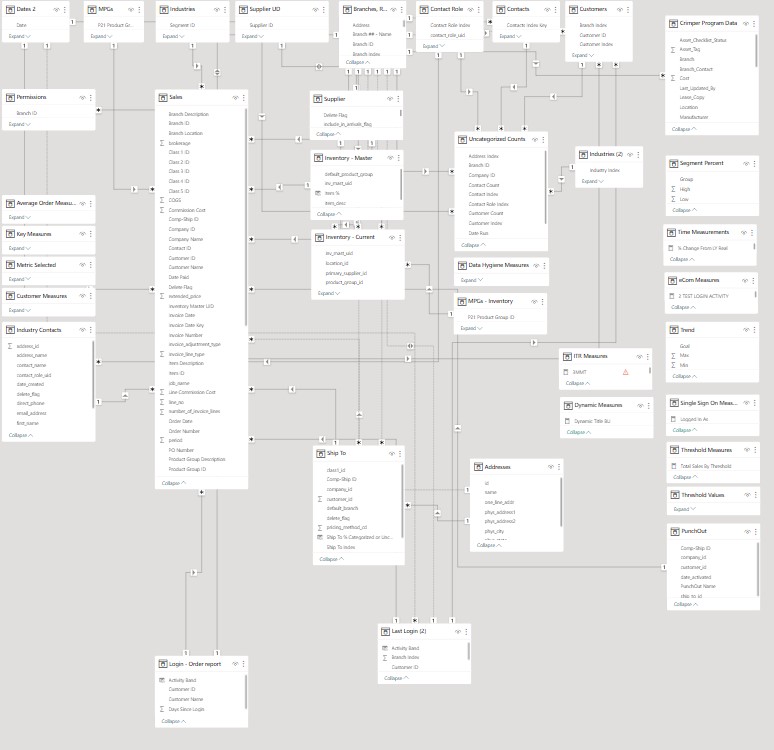
In my current role I work with the executive team, and they want all the information in one place. This includes sales data, inventory, data hygiene, Invoice details, Geo-mapping, additional programs, Industry data, etc. The problem has become quick fixes. Anytime they want something new it has to be added to the model and now its so larger that I’m not sure how to go about adding things, where to have relationships, etc. I’ve included a screen shot of the model.
Maybe compared to others it isn’t actually that large, and if so how do you manage the relationships between things?
Currently they want to see data together that doesn’t have a relationship and they want to add another fact table to bypass this.
Just looking for some guidance for those who do have experience with large models. Even if its that things need to be split into different reports.
Hi @michael.gyure - Please find the best practices and suggestions from Data Mentor.
Thanks
Ankit J
Addressing Complex Data Models in Business Analytics
Current Challenges
Large Model Complexity: Incorporating diverse data like sales, inventory, invoice details, geo-mapping, industry data, etc.
Quick Fix Requirements: Adding new data points frequently, complicating existing relationships.
Relationship Management: Difficulty in managing relationships between unrelated data points.
Recommendations
1. Understanding Data Modeling Strategies
There are primarily two approaches:
Single Comprehensive Model: Contains all related data, allowing for comprehensive analysis but can become unmanageable if too large.
Multiple Specialized Models: Separate models for different data domains and use cases. This can simplify individual models but may require more integration effort for cross-domain analysis.
2. Evaluating Your Current Model
Based on your scenario:
Assess Relationships: Ensure logical and necessary relationships. Utilize Entity-Relationship Diagrams (ERD) to visualize and manage complexity.
Fact and Dimension Tables: Ensure proper differentiation between fact tables (transactional data) and dimension tables (descriptive data).
3. Optimizing Large Models
If you’re sticking with a single model:
Data Partitioning: Split large tables logically (e.g., by time periods).
Aggregation: Pre-aggregate data where possible to reduce processing load.
Normalization: Ensure your model is well-normalized to avoid redundancy.
4. Best Practices for Relationship Management
Star Schema Design: Use star schema for simplicity and performance enhancement. Centralize fact tables and ensure dimension tables are related directly.
Data Marts: Create smaller, subject-specific data marts for complex analysis, each focusing on a particular business area.
Bridge Tables: Use bridge tables to handle many-to-many relationships and unanticipated data connections.
5. Tool and Process Recommendations
BI Tools: Use advanced features of Business Intelligence (BI) tools like Power BI for handling complex models.
Incremental Refresh: Implement incremental refresh policies to improve performance.
Data Versioning: Maintain versions of your data model to manage changes effectively.
Implementation Example
Pseudocode for Managing Large Models in Power BI (DAX)
Managing a large and complex data model involves strategic decisions about model structure, data relationships, and leveraging the right tools for optimization. Considering splitting unrelated data into different models or creating data marts can reduce complexity and improve performance. For hands-on learning and deeper insights, consider enrolling in advanced courses on the Enterprise DNA Platform.
This structured approach should help streamline your current data model challenges and align with best practices in Business Analytics. For further queries or personalized advice, feel free to reach out within our community.
I will preface this with - I prefer large models that cover multiple report requirements. Now that you know my bias, I’ll explain the structure we work with.
I am the only person in our organization (around 250 employees) who does any development in Power Bi. (this is one reason I am partial to large models - once a model is created, it speeds up moving on to other parts of the project).
I have four major groups in our company using Power Bi at the moment, they are: Accounting - C Suite - Office Supply Sales Team - Office Supply Delivery Team.
I am adding reports for our Furniture Sales Team, Furniture Quote Team, and our Custom Print department.
We have different ERPs for our different sales teams, as well as a different system for Accounting, and eventually I’ll probably layer in HR data. Ideally, I have different datasets for each of these, and possibly a dataset that combines a couple of the ERPs if needed.
For our Supply Sales team, which is the one I have developed the most solutions for at this point, I have 1 primary dataset - which covers most of their reports (26 to be exact), and I have another dataset that covers some reports that needed an additional dataset attached.
A few of my reports for the supply team do include a few measures specific to that report - those are at the report level, not included in the dataset.