I have searched the forum for an answer to this question however sadly cannot find so hoping to get an explanation here.
I am trying to find a way to show the MIN value of a cumulative total measure I have created for any given timeframe. The issue I am having is that I can’t use MIN or MINX etc. on the created measure in a way that works for what I need.
The Data Model consists of a fact table containing financial actuals for a given month in a “Value” column by “Period”, “Line Item”, “Currency” and dimension tables for Currency, Date, and Groupings which consolidates the line items up into various categories and whether it relates to P&L actuals or Cash actuals.
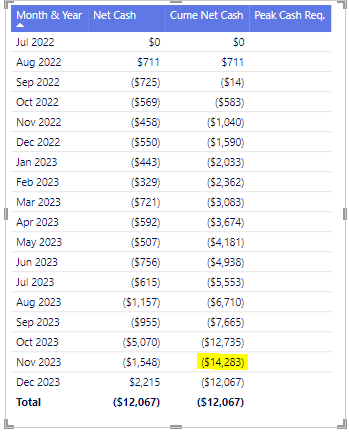
My ultimate output is to show a “Peak Cash Requirement” for any given date range which will represent the lowest cumulative cash total in that timeframe. As an example, in the screenshot below it would equal $-14,283.
My Net Cash Measure is a sum of the financial values, filtered for the required line items that make up net cash and I have calculated the Cume Net Cash Measure as per below
It may be that I am not fully understanding your response but I don’t think this will work for me since [Net Cash] is not a column in a table but a measure I created so when I start to write “ALLSELECTED(” for the first variable I can’t reference Net Cash. Unfortunately as the model contains sensitive data, I can’t share here so I will try to explain my steps in more detail:
Here is a snapshot of my fact table called “Financials”:
I need to be able to calculate the MIN of 3) for any given date range
Regarding the Cume Net Cash Measure, I think what I have works for the purposes I need since it needs to be cumulative from the first point in time. It is only the end point that changes based on those filters (i.e. it is cumulative ITD)
Thanks again and apologies if I am missing the obvious here!
Following on from my post above, I have spent some more time trying to work this out, sadly to no avail. In order to make things easier to look at, I have created a dummy file with random data that replicates the data model I have created. It won’t make much sense from a financials point of view but it does highlight the issue I am having.
I need to be able to callout the below value in yellow which is the lowest cumulative net cash value in this particular slate year, so represents our “peak cash requirement”
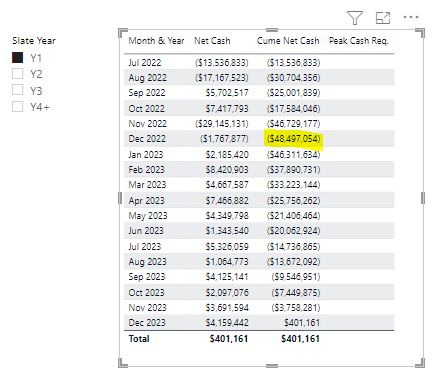
Similarly, I need to be able to show this for Y2, Y3 etc based on the cumulative CF for ALL years prior.
You can see the measures I have created to calculate both Net Cash and Cumulative Net Cash which seem to work as needed. The issue is that I can’t find a way to calculate the MIN of this cumulative CF measure. As far as I can tell, I can only calculate the MIN if it appears as a column in a table (virtual or otherwise) rather than a measure.
I did try and create a virtual table which I have managed to get to show Net Cash by month however I can’t then find a way to show the cumulative total of this Net Cash as a separate column, which I could then apply MINX to.
Attaching the file and any additional help would be much appreciated. It is driving me mad!
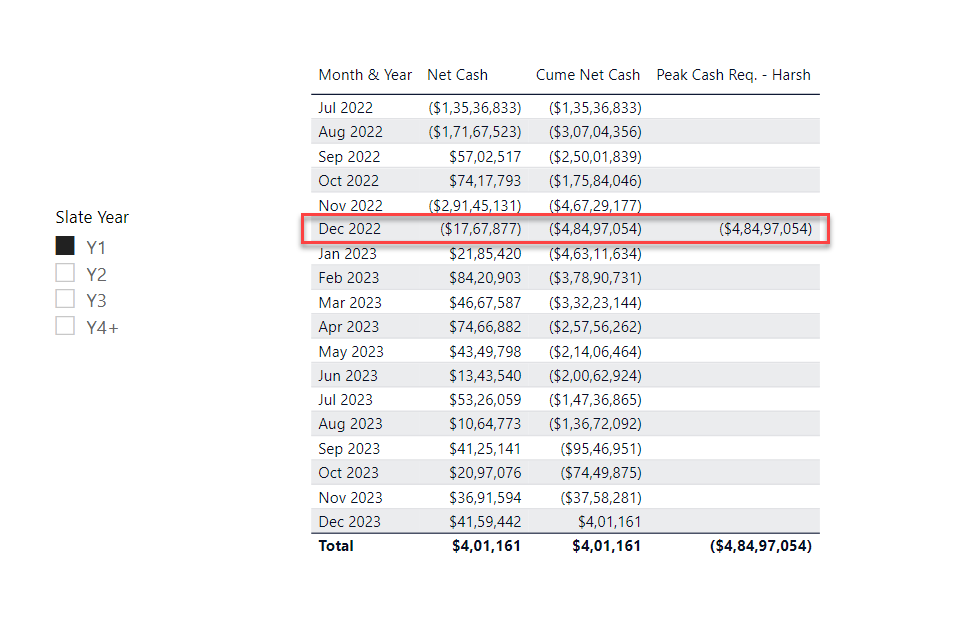
In order to achieve the results based on the scenario that you’ve mentioned. Below is the DAX measure alongwith the screenshot of the final results provided for the reference -
Peak Cash Req. - Harsh =
VAR _Cumulative_Values =
[Cume Net Cash]

VAR _Lowest_Cumulative_Value =
CALCULATE(
    MINX(
        FILTER( Dates ,
            Dates[Date] >= MIN( Dates[Date] ) ) ,
        [Cume Net Cash] ) ,
    ALLSELECTED( Dates ) )

VAR _Results =
SWITCH( TRUE() ,
    ISINSCOPE( Dates[Month & Year] ) && [Cume Net Cash] = _Lowest_Cumulative_Value , _Lowest_Cumulative_Value ,
    NOT ISINSCOPE( Dates[Month & Year] ) , _Lowest_Cumulative_Value ,
    BLANK() )

RETURN
_Results