Min, Max & Avg slicer based on other filters

Regret for posting again. I didn’t get any respond so far.

I need Min, Max and Avg slicer based on Selection 1 and 2 slicers.

Please find the attached pbix file. It would be great for me if you could resolve it.

Thank you,

Sample Data for Dynamic Slicers.pbix (106.3 KB)

Hi @khurram ,

Thank you for waiting.

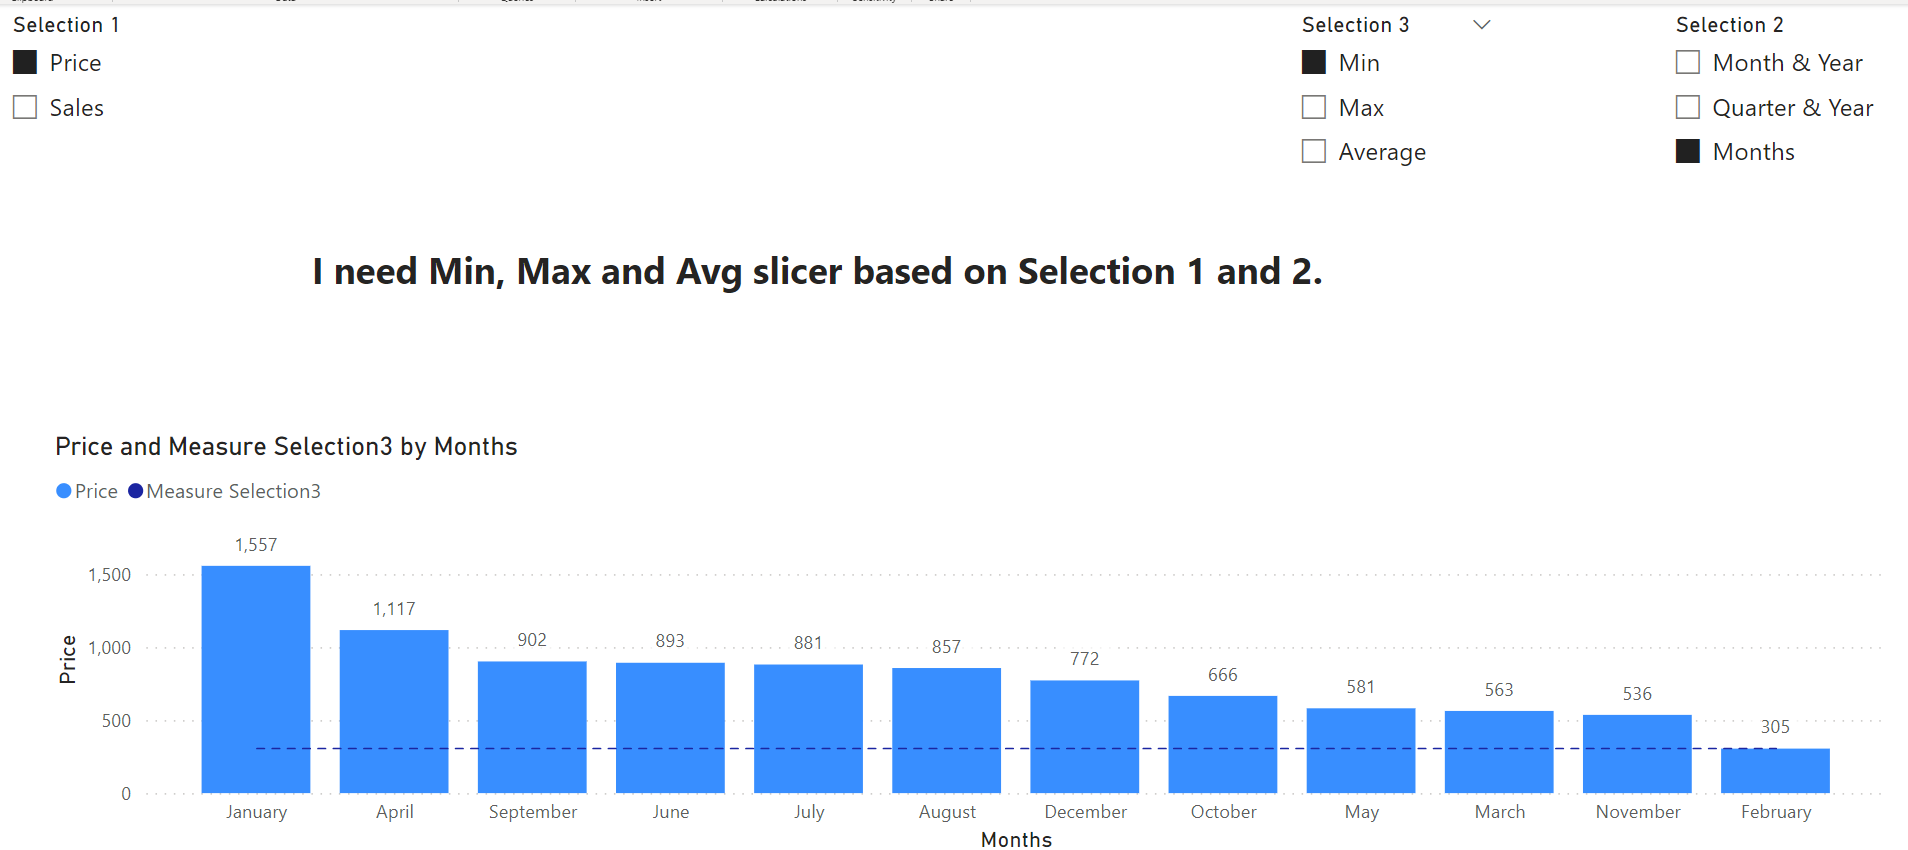
In this solution I add third Slicer (Selection 3) - Min, Max, Avg and then make measure calculation based on Selection 1, 2 and 3.

I used measure branching technique - build measure on top of other.

Short description:

So we have 3 selections :

  • measure selection (Selection 1 slicer)

  • granularity selection (Selection 2 slicer)

  • Min, Max, Average function selection (Selection3)

  1. Slicer 1 (Measure selection ) - additional measure is created:
Measure Selection1 = 
 Var _MetricSelection =  selectedvalue('Selection 1'[Selection 1 Order])

    Return
        switch(_MetricSelection,

        0, [Price],
        1, [Sales]
            )


  1. and then I create sub-mesure for each function that you would like to have on Slicer 3 - minimum example (but it similar for max and average) - both Selection 1 (Measure) and Selection 2 (granularity) is used:
  • select granularity - and check scenarios based on the selection

  • for measure - previous created [Measure Selection1] is used

min value = 

    var _granularity = SELECTEDVALUE('Selection 2'[Selection 2 Order]) 

    Return
    if(isblank([Measure Selection1]),blank(),
                calculate( 
                    switch(_granularity,
                        0,minx(filter(values('Calendar'[Month & Year]),[Measure Selection1]>0),[Measure Selection1]),
                        1,minx(filter(values('Calendar'[Quarter & Year]),[Measure Selection1]>0),[Measure Selection1]),
                        2,minx(filter(values('Calendar'[Months]),[Measure Selection1]>0),[Measure Selection1])
                        ),
                    
                     ALLSELECTED('Calendar'
                    ))
   )

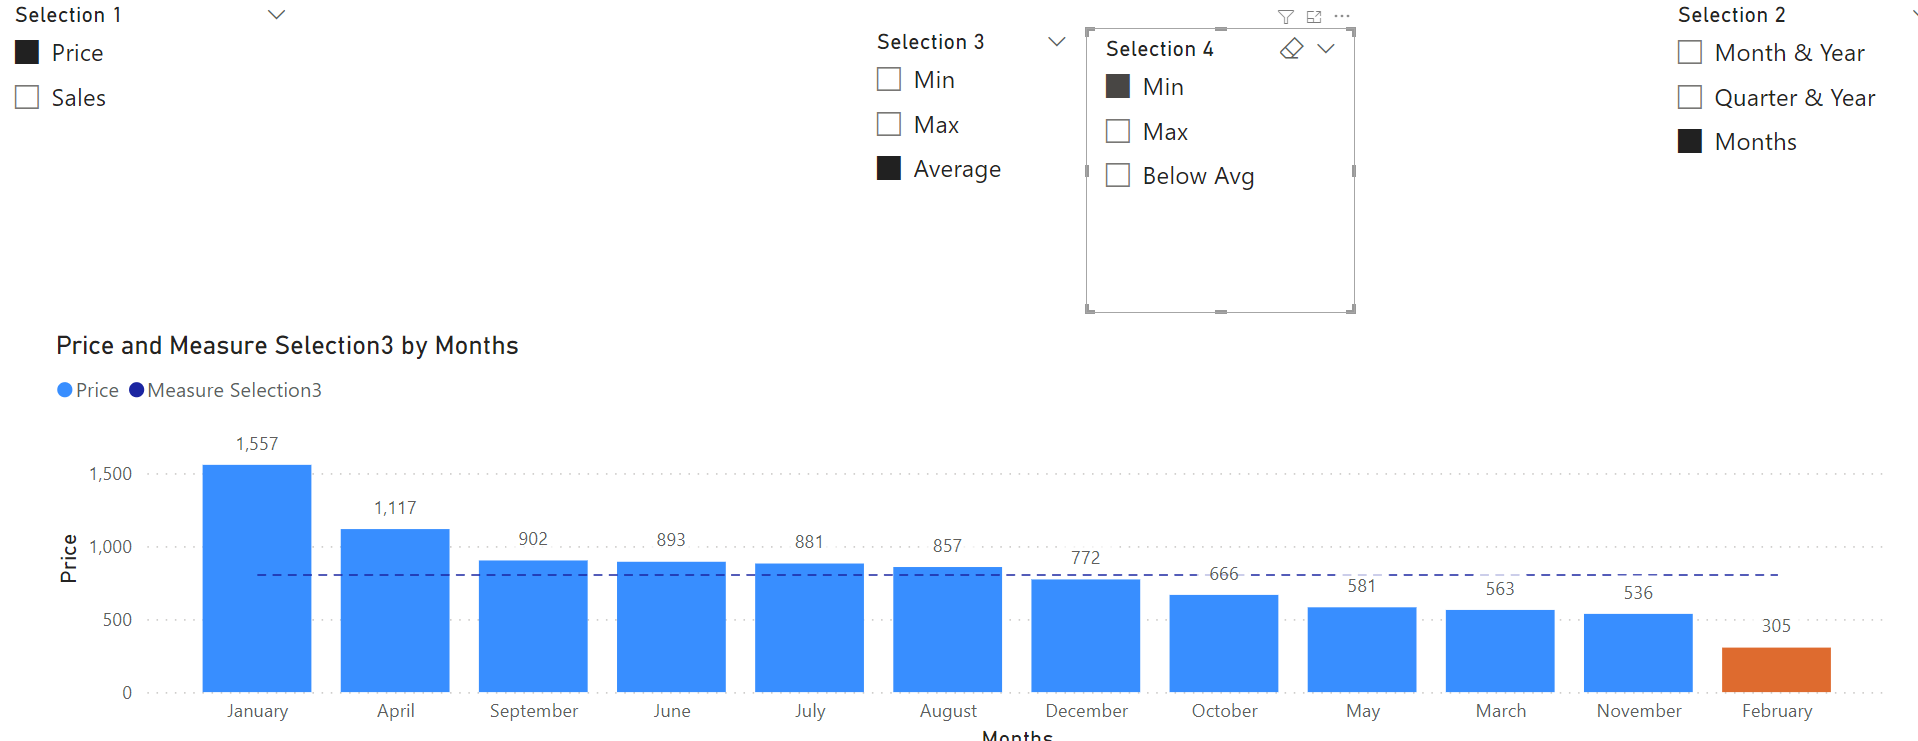
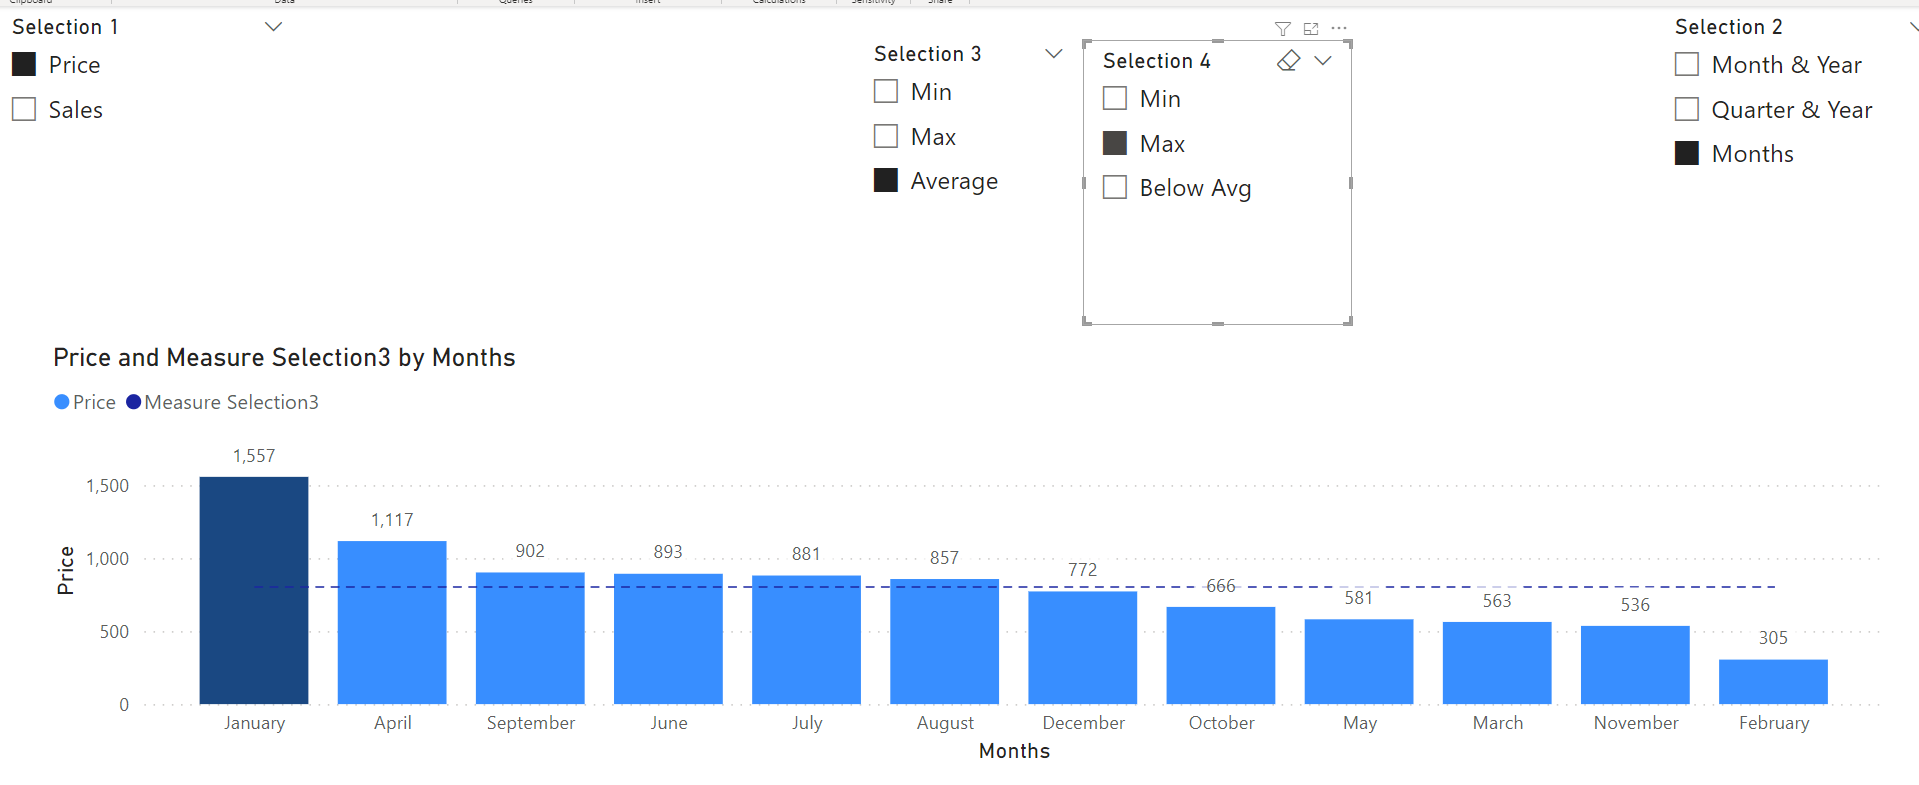
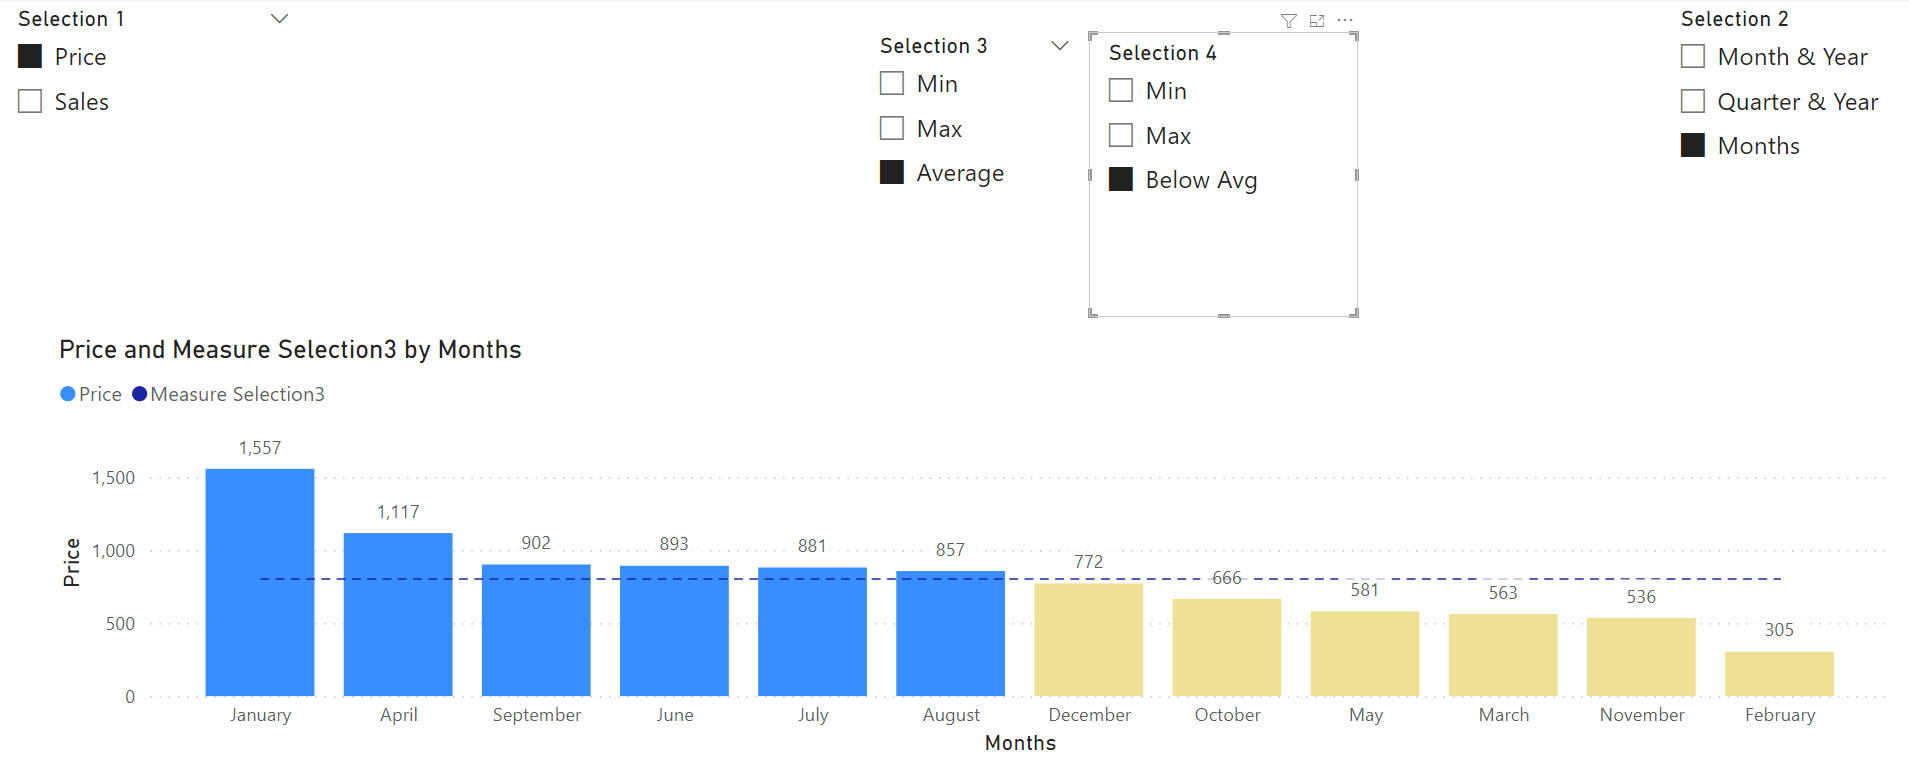
  1. and then you have all bring together ( Selection 1 (measure), Selection 2 (granularity) and Selection 3 ( function)
Measure Selection3 = 
 Var _MetricSelection =  selectedvalue('Selection 3'[Selection 3 Order])

    Return
        switch(_MetricSelection,

        0, [min value],
        1, [max value],
        2,[average value]
            )

So you can use and display i.e on chart like this

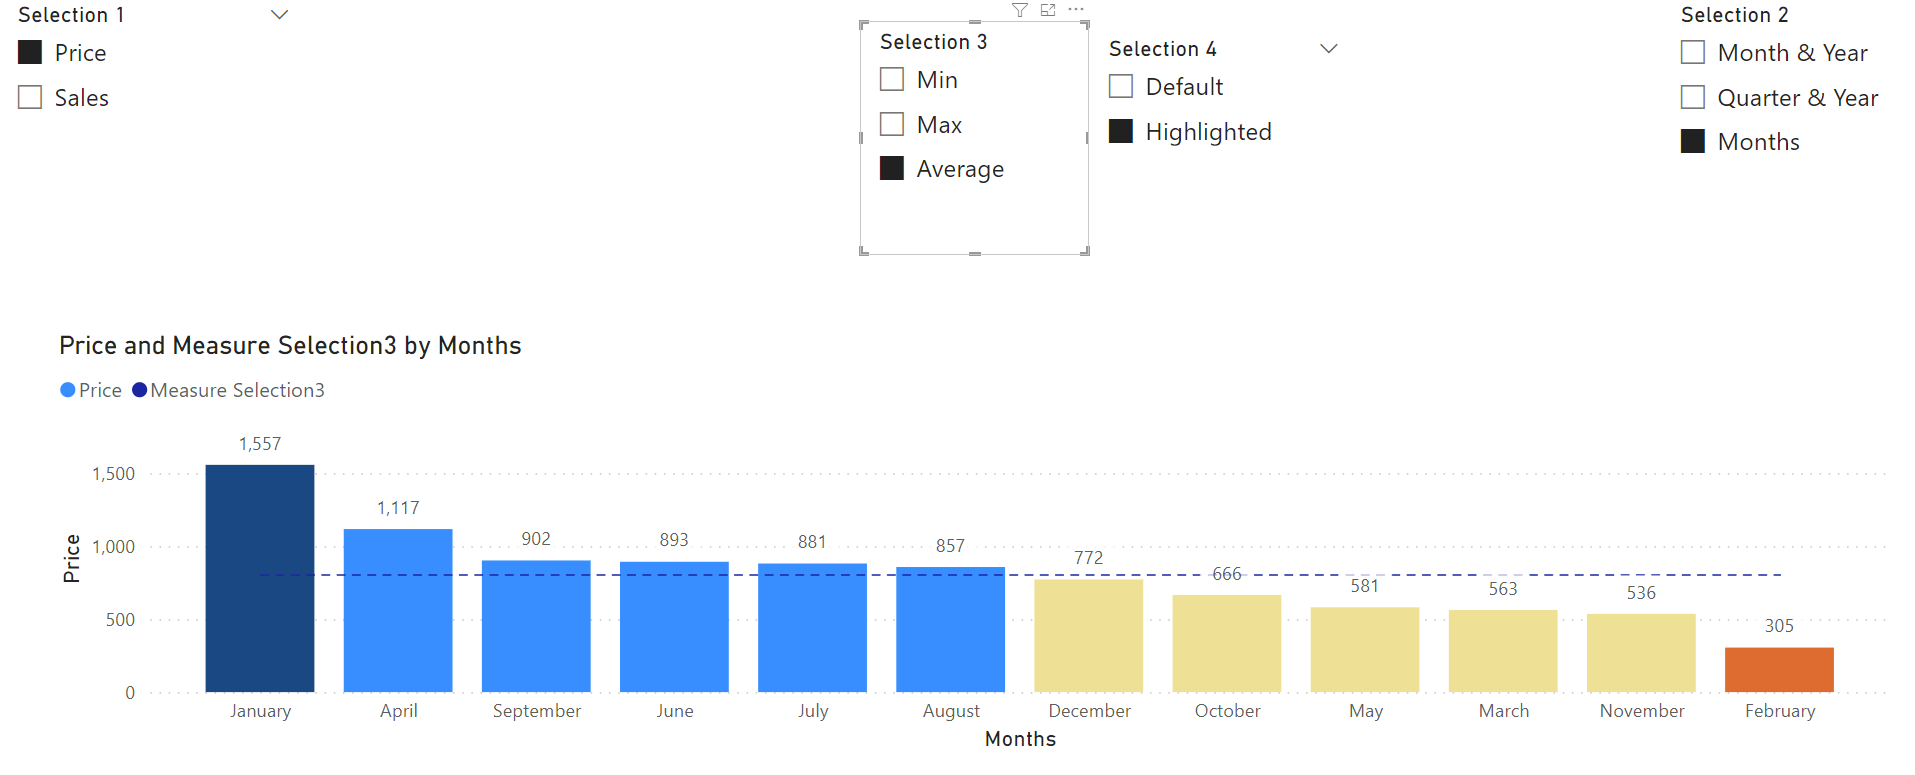
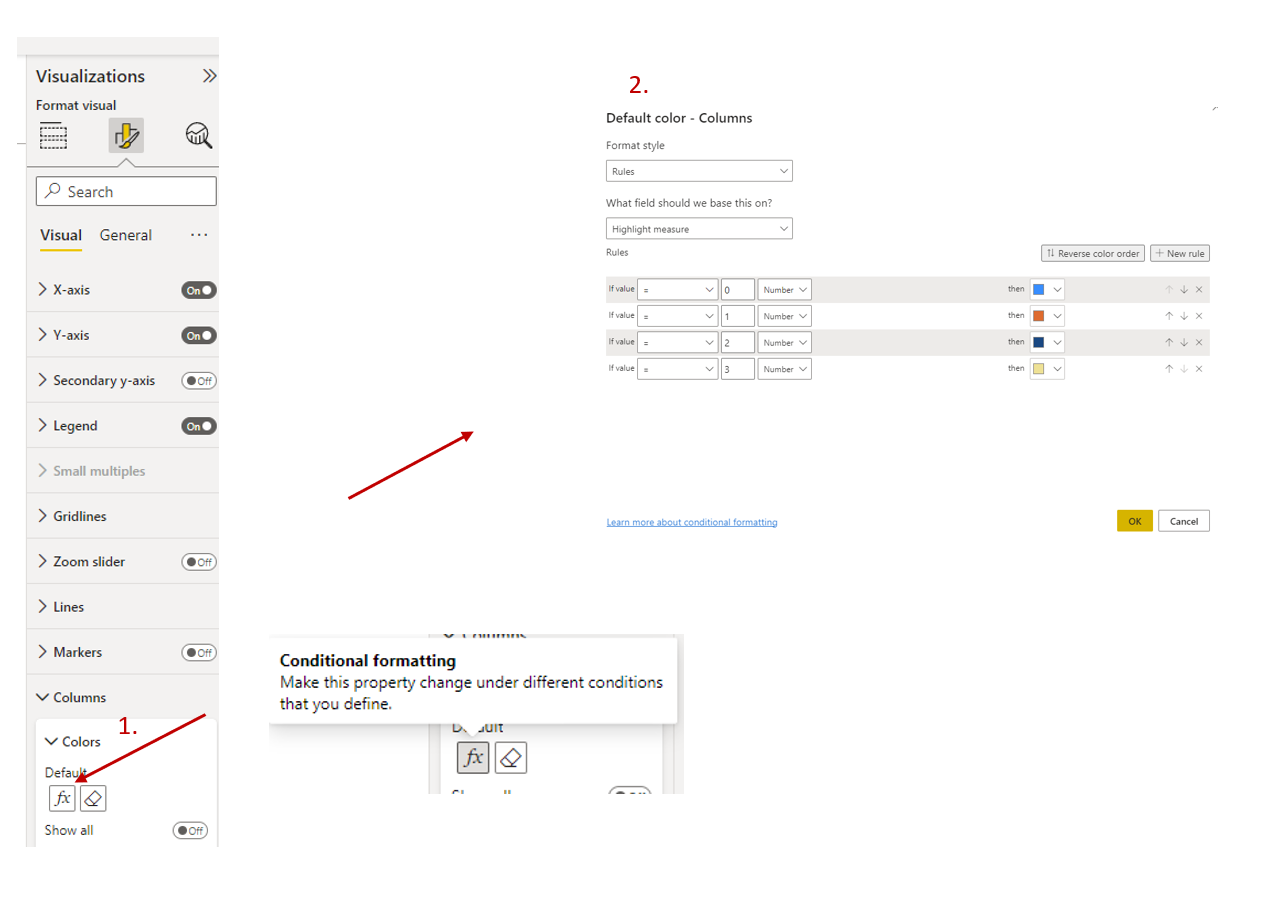
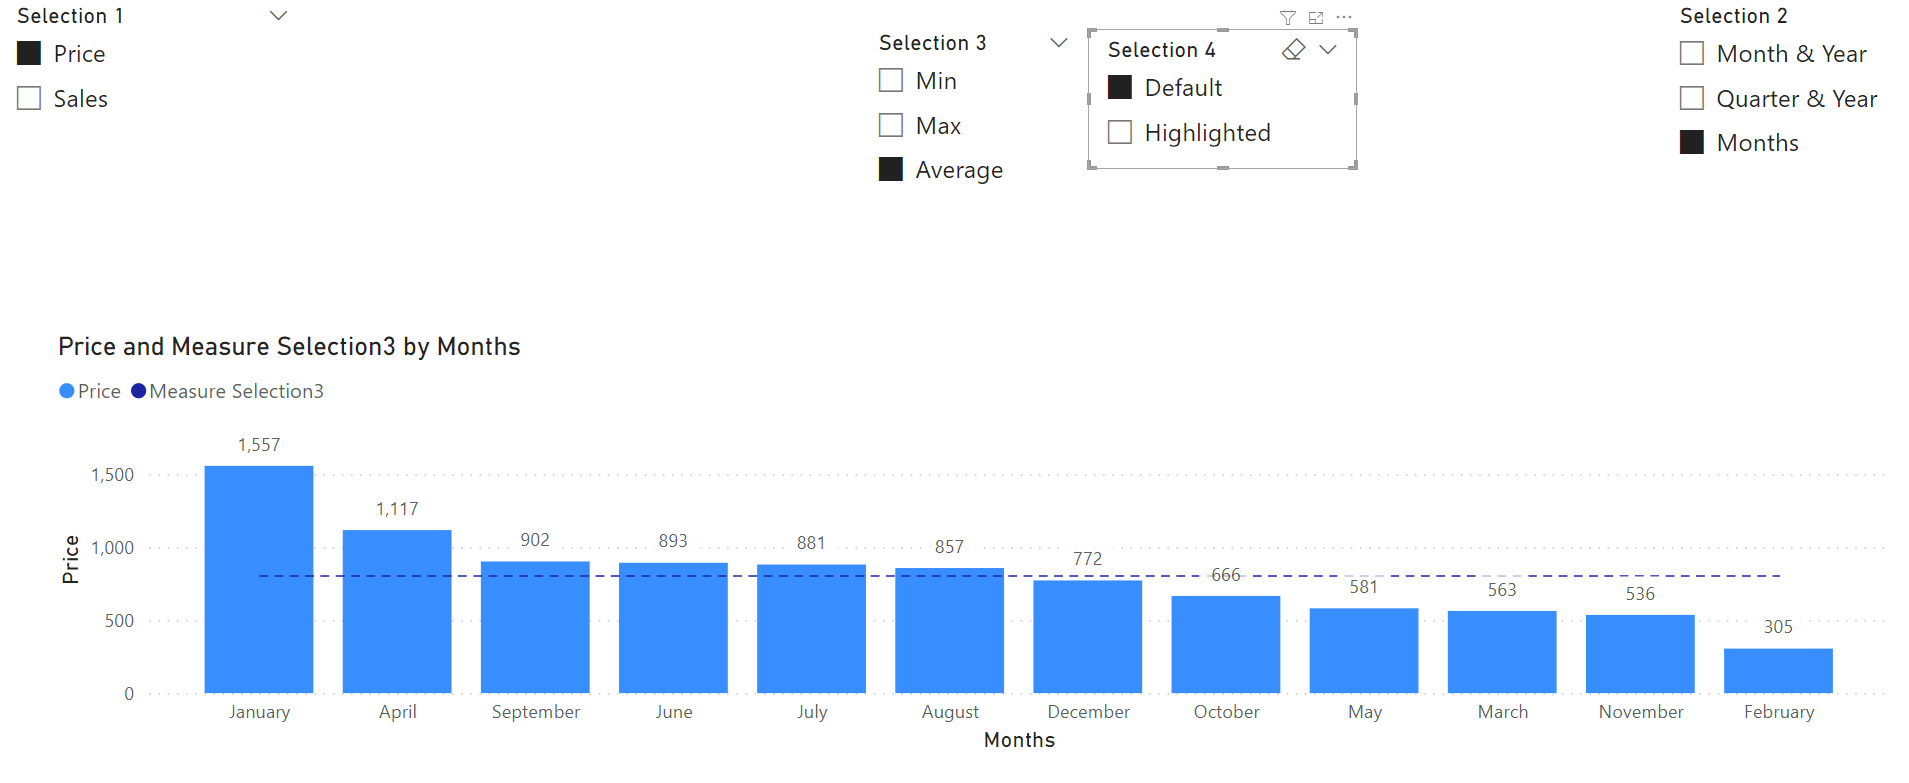
This is a basic concept. Later it can be formatted, Hide title like :

etc.

Sample pbix file:
Sample Data for Dynamic Slicers_khurram.pbix (109.9 KB)

Hope this is what you’re looking for

1 Like

Thanks a lot Maja. You did exactly what I was looking for.

Further more I need one more step in the same module. Could you please resolve in same file. I need one more slicer to highlight Min, Max and Below averages bar in the same chart.

I really appreciate your help.

Best Regards,

1 Like

Hi @khurram ,

Regarding your last post, I add another Slicer 4 (with just 2 options): Default and Highlighted

Behind the scene :

  • on additional measure is added :
Highlight measure = 
VAR _highlight = SELECTEDVALUE( 'Selection 4'[Selection 4 Order] ) 
VAR _min = [min value] 
VAR _max = [max value] 
VAR _avg = [average value] 

RETURN
switch(
    _highlight,
    0,0,
    1,
    switch(
        true(),
        [Measure Selection1] = _min, 1,
        [Measure Selection1] = _max, 2,
        [Measure Selection1] < _avg, 3,
        0
    )
)

So it gives
0 - for default
1- min
2-max
3 - below average

Now we need to use this to conditional format column bar color like this:

Sorry about color pallete - I just pick first and different colors (from available color pallete) so you can see more clearly what happens.

for 0 use the same color as original / default column bar.

Same file:
Sample Data for Dynamic Slicers_khurram v1.pbix (112.9 KB)

Hope you enjoyed exploring this new options.

Best regards,
Maja

Default - nothing change

Thanks a lot for responding prompt.

Really It’s very interesting and new techniques for me, it can be fit in mostly dashboards.

In highlighted scenario, I need one more slicer with (3 options) Min, Max and Average , when I click min it will highlight min value and so forth.
Here I don’t need default option, not selected will be remain default.

Regret I am taking your more time.

Thanks & Regards,

Hi @khurram ,

Update Selection 4 (What to highlight) - to min, max, below average,
after that change Highlight measure


Highlight measure =

VAR _highlight = SELECTEDVALUE( 'Selection 4'[Selection 4 Order] )

VAR _min = [min value]

VAR _max = [max value]

VAR _avg = [average value]

RETURN

switch(TRUE() ,

    _highlight =0 && [Measure Selection1] = _min, 1,

    _highlight =1 && [Measure Selection1] = _max, 2,

    _highlight =2 &&  [Measure Selection1] < _avg, 3,

    0

    )

And chart select automatically with previous formatting

or for below average

Pbix file

Sample Data for Dynamic Slicers_khurram v2.pbix (112.9 KB)

Best regards

Hello Maja,
Superb! thanks a lot for your great efforts.

In selection 4 highlighted slicer, when I not select any options, it has highlighted min values instead of default (it should not be highlighted any values )
May I know how I fix it?

Best Regards,

Hello @khurram ,

Sorry, my mistake - it was late in the night and I want provide you answer ASAP.

Just one check if is not selected (BLANK)


Highlight measure =

VAR _highlight = SELECTEDVALUE( 'Selection 4'[Selection 4 Order] )

VAR _min = [min value]

VAR _max = [max value]

VAR _avg = [average value]

RETURN

IF( NOT(ISBLANK(_highlight)),

switch(TRUE() ,

    _highlight =0 && [Measure Selection1] = _min, 1,

    _highlight =1 && [Measure Selection1] = _max, 2,

    _highlight =2 &&  [Measure Selection1] < _avg, 3,


        0
[Sample Data for Dynamic Slicers_khurram v2.1.pbix|attachment](upload://athmW7y4baaQUn6c4kBoslMIXr3.pbix) (112.7 KB)


    ),0)

Sample Data for Dynamic Slicers_khurram v2.1.pbix (112.7 KB)

Best regards

Perfect Maja! Finally I have achieved my results just because of you through EDNA forum.

God bless you,

Thank you once again.

1 Like

You are welcome. I am glad that I can help and that you finally find solution.

That’s the purpose of the forum.

Enjoy in your analytics.

Hi @khurram,

One more note - need to give a credit to @Gustaw for his winning solution for Challenge 22:

more you can find at:
https://app.enterprisedna.co/app/showcase

Maybe you can catch up some other brilliant ideas.

Thank @Gustaw again for sharing.

Hi Maja,

Thanks for addressing Gustaw. I really love his presentation. I am applying his technique in my existing dashboard. Thanks a lot @Gustaw and @mspanic .

This forum is full with experts EDNA team.

1 Like

Hello Maja,
Hope you are doing well!

Just a little adjustment need to do in the existing model. I am trying to achieve dynamic legend based on parameter slicer (Min, Max and Avg) it’s working properly. when I haven’t selected anyone of those it’s showing all lines instead of no mention any line. May I know how to fix it. Please find the attached pbix file.

Thanks & Regards,

Sample Data for Dynamic Slicers_khurram v2.1.pbix (116.3 KB)

Hi @khurram ,

That is a ‘official’ limitation of field parameters:

  • There’s no way for your report users to select “none” or no fields option. Selecting no fields in the slicer or filter card is the same as selecting all fields.

more you can find at:

You can use Measure Selection 3 measure options for that - but you don’t have dynamic legend options with that solution.

Maybe to use workaround to have 2 measures: Measure Selection 3 measure and title - display measure, hide legend title (with rename visual title as empty text) and add text to display title on top of that
to have something like that:

image

Warm regards

hello @khurram and @mspanic

In such cases, we can use formulas as isfiltered or iscrossfiltered to return given condition (e.g. false if none of options are selected) and program measures (blanks) or colors accordingly.

I added a few formulas. Please, check them while reviewing new version of pbix file.

Please find pbix below (with applied update) and let me know if this display what you are looking for.
At the end of the day, we could also synchronize your selections for colors and lines (e.g. when selecting “max” you would get both max line and color for given column for max value accordingly). It’s 100% possible, but it will require a few further adjustments.

Best regards!

Sample Data for Dynamic Slicers_khurram v2.2 GD.pbix (119.5 KB)

2 Likes

Hello @Gustaw ,

Thank you for sharing this trick. Great to see MasterChef at work.

Best regards

1 Like

Thanks a lot @Gustaw and @mspanic.

The measures is bit complex but interesting. @Gustaw I liked your all dashboard presentation.

I really appreciate your support in this matter.

2 Likes