Hi @mdalton2100,
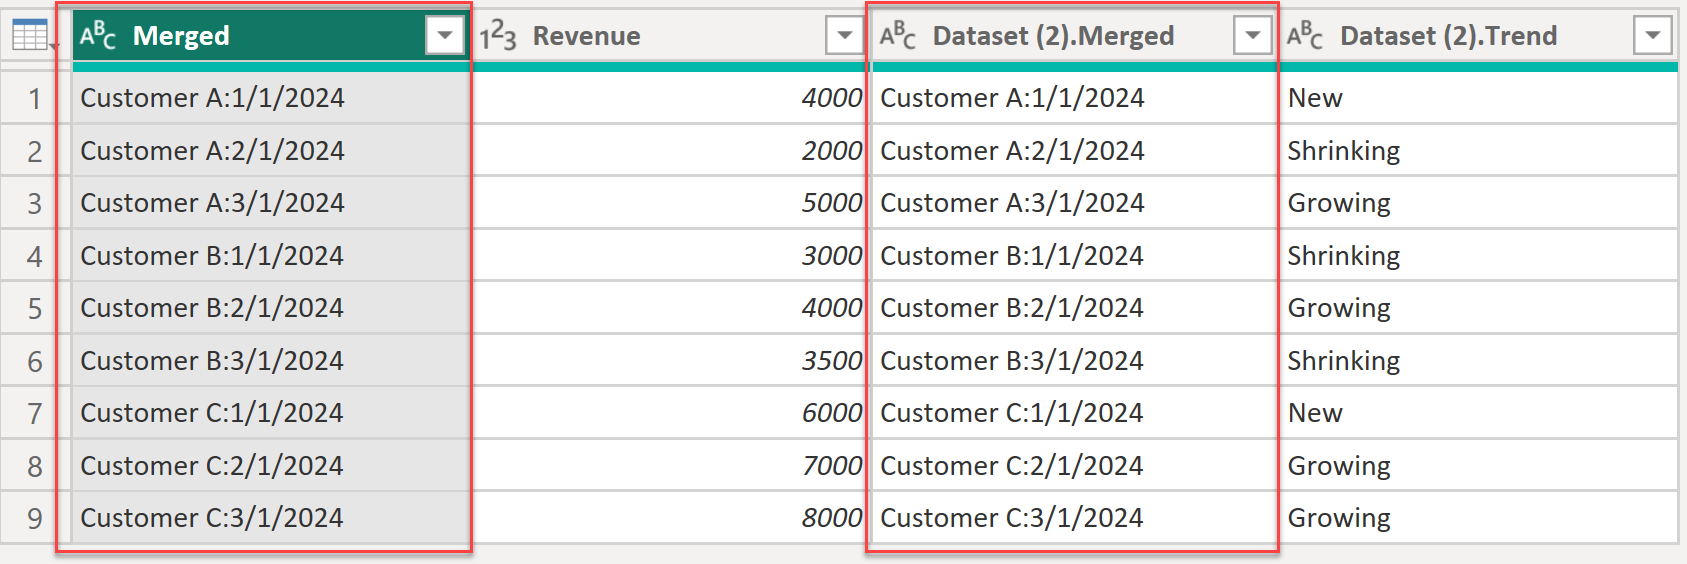
You can achieve that using mostly the UI, see this approach
let
    Source = Table.FromRows(Json.Document(Binary.Decompress(Binary.FromText("i45WUtJRCkotS80rTcXBciwuTi0uzk3NK8HDidUBm2Soa6hrZAJkGMEYxjAGTimQVufS4pL83NQiBUeguImBgYECSCGUNoXSfqnlQDI4oygzLzszLx3Idi/KLwexUIxwAhkN1QIzytgUQmPTjCyKYpAzUMoMaoA5lLZAcQvCCLhLYgE=", BinaryEncoding.Base64), Compression.Deflate)), let _t = ((type nullable text) meta [Serialized.Text = true]) in type table [Column1 = _t, Column2 = _t, Column3 = _t, Column4 = _t, Column5 = _t, Column6 = _t, Column7 = _t]),
    RemoveFirst = Table.Skip(Source,1),
    PromoteHeaders = Table.PromoteHeaders(RemoveFirst, [PromoteAllScalars=true]),
    UnpivotOthers = Table.UnpivotOtherColumns(PromoteHeaders, {""}, "Attribute", "Value"),
    RemoveCols = Table.RemoveColumns(UnpivotOthers,{""}),
    ReplaceValue = Table.ReplaceValue(RemoveCols,each [Attribute],each Text.BeforeDelimiter([Attribute], "_"),Replacer.ReplaceValue,{"Attribute"}),
    GroupRows = Table.Group(ReplaceValue, {"Attribute"}, {{"t", each Table.FromColumns( { List.Alternate([Value], 1, 1), List.Alternate([Value], 1, 1, 1)})}}),
    ExpandTable = Table.ExpandTableColumn(GroupRows, "t", {"Column1", "Column2"}, {"Column1", "Column2"}),
    ChType = Table.TransformColumnTypes(ExpandTable,{{"Column2", Currency.Type}}),
    PivotCol = Table.Pivot(ChType, List.Distinct(ChType[Attribute]), "Attribute", "Column2", List.Sum)
in
    PivotCol
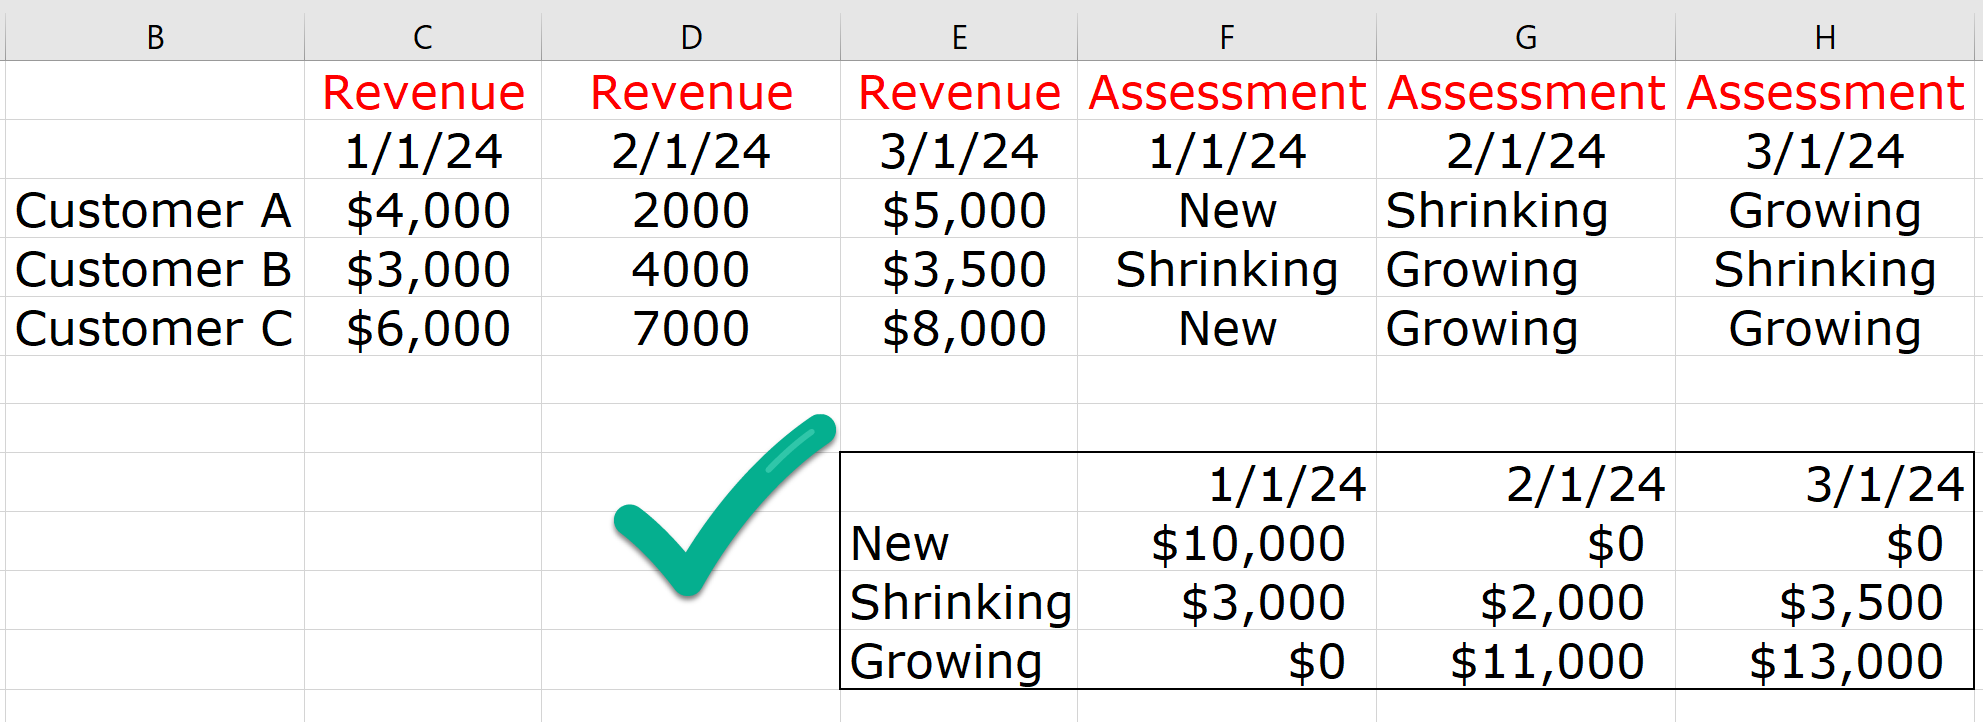
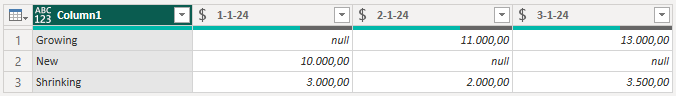
With this result
I hope this is helpful