Currently testing an issue I am having. I have 8 bookmarks on on one page - each bookmark has a chart and a visual.
Generally speaking the charts seem to work but I seem to be getting a random issue. A random visual regularly fails with error:Memory Error: the memory used for the current operation exceeds the memory limit for the workload group
I have created a test report with just one bookmark and the same happens.
Googling does not seem to bring back an obvious answer.
Currently working in Desktop. The source is a data set in Power BI Service.
Sorry I dont understand. Quite new to Power BI and the internals. I wopuld not have thought that a line and stacked column chart or Matrix with four columns wouls take long to render.
So how do I get the visuals to work because currently this is unacceptable that the reports wont work.
I’m not well versed with the intricacies of the Power BI Service memory use, but the reference to the workload group would give me pause to check how other reports in this same workgroup are responding: are they slow as well? Is this perhaps a server issue and not a report issue?
Apologies. My report takes the data source from a Data set in the power BI Service. I thought that when the report opens in Desktop that the model would be in the memory of the laptop I am using not on the service. If thats not the case this will not scale?
Thanks
E
OK,
I think I can see where @Greg and @ricardocamargos88 are coming from. It does not look like I have access to the monitor.
@datazoe,
I have a feeling it is the volume of data with the visuals. I can limit the data based on the attributes currrent rank. This cuts the visual down to 25 but Performance analyser shows it takes longer.
As an aside I will be looking at reducing the size of the data set. I have filtered he data so I know it will grow so a little trim now will help.
Thanks
@ells
When you upload to the service ( I’m assuming you are using the PRO version and not the premium version) there is ~2gig max of memory available during query time, i.e. a dax measure. When using the desktop version you are only capped on the amount of memory on the physical machine. If at all possible please upload the pbix file and we can look at further. Chances are there are measure(s) that can be optimized to use less memory.
@ells you mentioned rank, and I have found that rank DAX measures are heavy on the calculation side of things too.
For the size of the data set, another thing to look at , if you haven’t already, is calculated columns. They tend to increase a model size very quickly. There are a number of strategies for optimizing those, from keeping them in a smaller dimension table or keeping it closer to the source. An example would be a calculated column to concatenate two text fields firstName + lastName. That can be done with merge columns in transform data or even as part the loading SQL query. Using the X functions (sumx, averagex) also can alleviate the need for them.
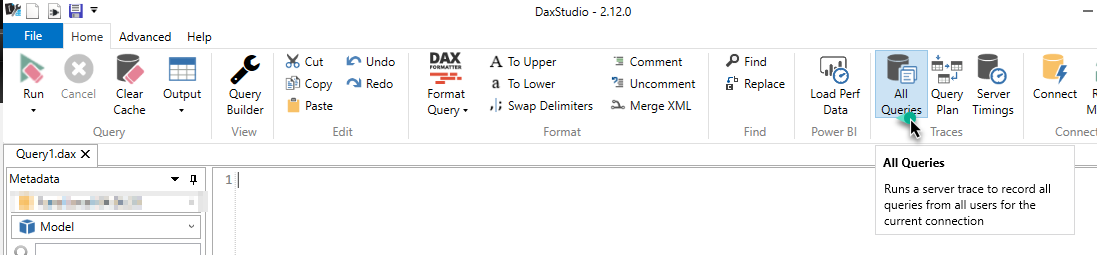
Understandable. Since you are looking at the VertiPaq Analyzer you are familiar with Dax Studio. I’d use that and all the “All Querries” option in Traces, and see if there a measure that is taking a lot of memory
Since you are hitting a memory issue, I’d bet that you if you look at the various measures you are using, but turning on Server Settings and Query Plan, you will see alot of rows/records being used. These temporary tables are stored in memory. But hard to say exactly w/o seeing anything. But start with the All Queries and if see if anything jumps out.
Plus be sure that your data model is set up as a star schema or even snowflake schema. Try not to have bidirectional relationships or many to many.
I seem to be fuill of dumb questions. Number 1 is DAX studio connects to the local copy of the data set. So have been looking through the info there. Can it connect to the one in the Power BI Service as that would be awesome?
Some other issues are coming to light as I work through this. My tinternet connection is not good. I have swapped from wifi to wired (think its the strain of everyone working from home). In addition it looks like there are other workspaces in the Power BI Service that may be using a lot of processing power. I can only see what is occuring in Dev. I think this could be masking the issue. Was working fine and then I suspect someone has kicked off a big refresh or two and now down to snails pace.
Trying TopN filters on the chart and Matrix. At worst we are up to 146,799 ms to refresh a visual. Still a long way to go
Thanks
E
Nope, no dumb questions. I consider myself pretty good at all this stuff and still find myself asking simple questions.
I believe it will only connect locally and not in to the service. My thinking here is that if we can find why a measure is taking so much memory (which could be a data modeling issue and/or DAX issue) we can start to troubleshoot that. If we see that “Measure A” is taking the longest locally we can assume that it is causing, or at least contributing to, the issue with the service. And the only nice way to get that info is through DAX Studio using the Query Plan and Serving Timings
That may contribute to a slower rendering of the visuals and such, but the memory being used would still be relatively the same I believe. But that I’m not 100% sure on, but I would start with the data model and look at the various tabs in the “VertiPaq” Analyzer" and see if anythings stands out. Pay special attention to the “Cardinality” column. Then I’d look at the All Queries and then the Query Plan and the Serving Timings.
Perhaps you can post a screenshot of the data model diagram and the “Tables” tab out of DAX Studio–>Advanced–>View Metrics–> Tables tab?
The issue seems to be the Power BI service is not using Premium capacity, followed by other workloads, a bloated dataset, cumulative calculations being the icing on the cake.
We now have something workable that when it moves to Premium will be a lot quicker.
E