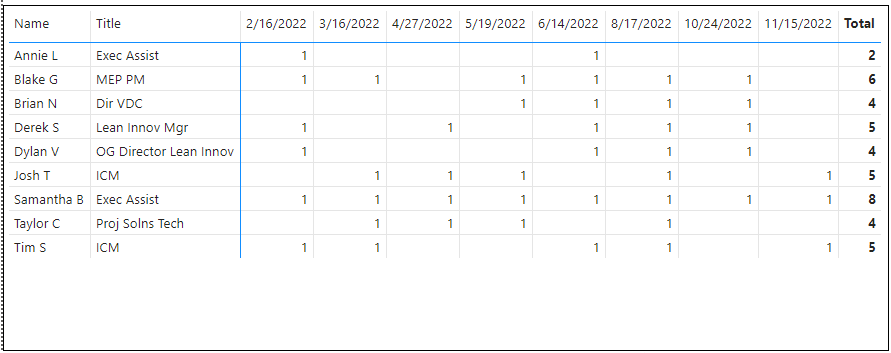
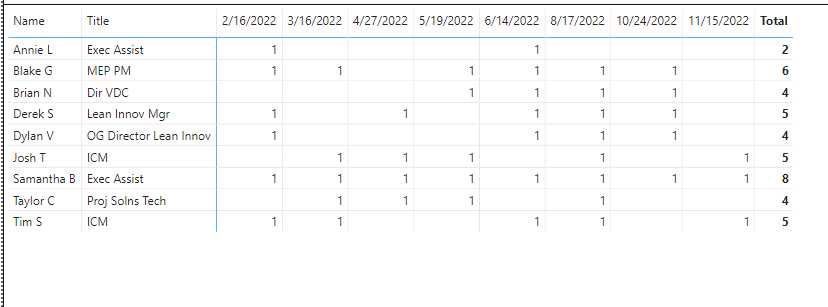
I’ve sifted through a handful of related search topics, but am missing the key thread. Attached are 1) a basic meeting attendance tracking sheet and 2) the associated pbix built from the Excel source.
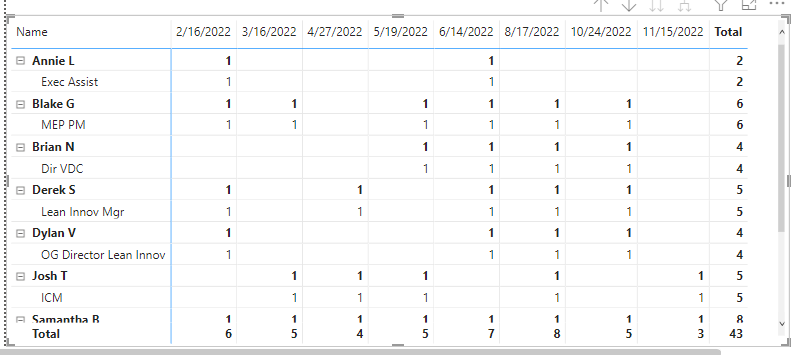
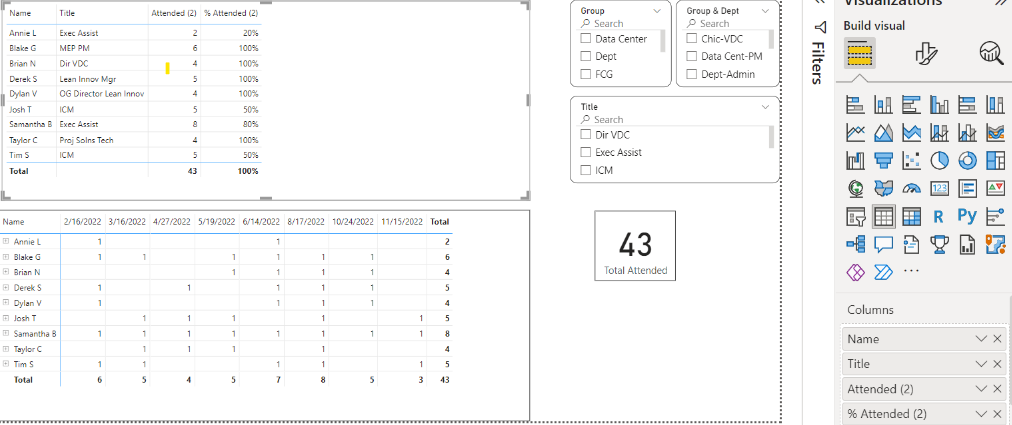
My confusion lies in the use of Meeting dates as column headings which I have unpivoted in Power Query Editor. With an objective to show a visual like the matrix one I built (which needs the Attendee=1 filter), but with basic new measures for a) total meetings held (8 to date), b) % of meetings attended by the person (Name). As a secondary issue - again, easier in a table visual than a matrix - I’d like Name and Total to be one row rather than expanded.
I’m just not clear if unpivoting the Date column headings - and changing their Type=Date is a benefit or not. Can you take a stab at this table and its “count of meetings held” and “% attended” by each person or persons?
BTW, the Total counts from the matrix visual are a positive to show, and there is no need for another measure of “% of all invitees who attended a specific meeting [date]”.
At its core, it’s likely a question over pivoting vs. unpivoting, and applying the appropriate DAX after Power Query Editor structures the data properly … hoping the community has an approach to try.
I’m confident that once this spreadsheet produces the requested report & measures that when columns are inserted for new meeting dates and attendees, I’ll understand how the recommended approach handles it.
Thank you!
Definitely an excellent advancement.
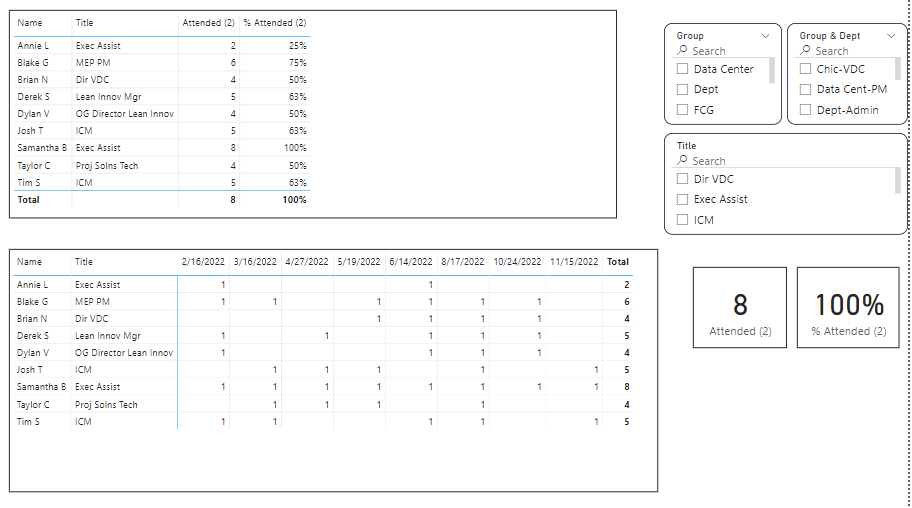
‘Attended 2’ is useful on a person-by-person basis.
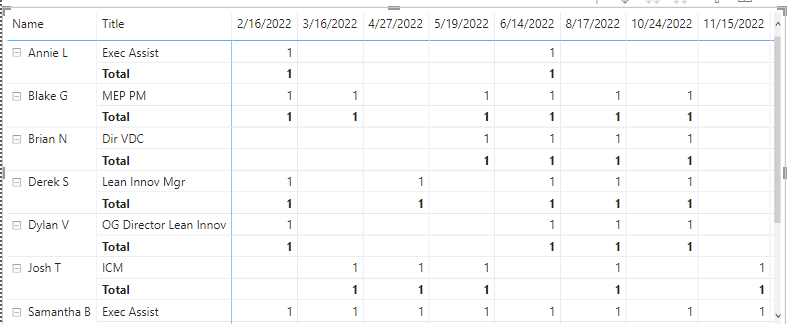
I’ve attached a basic table visual to illustrate the remaining "Total Meetings Held’ and the “% Attended” measure.
‘Total Meetings Held’ should be the count of meeting dates… there are currently 8 in total.
‘% Attended’ should equate to DIVIDE(‘Attended 2’, ‘Total Meetings Held’).
Thus, ‘Total Meetings Held’ - as meeting dates (columns) continue to be added and unpivoted - is the key remaining measure.
note: I don’t believe "% Attended (2)’ is currently accurate here as the table visualization shows.