Measures Using Date Table

I’m attempting to create a model of employee survey data for 3 different years (2016, 2018, 2020). I’ve run into an issue and need help.

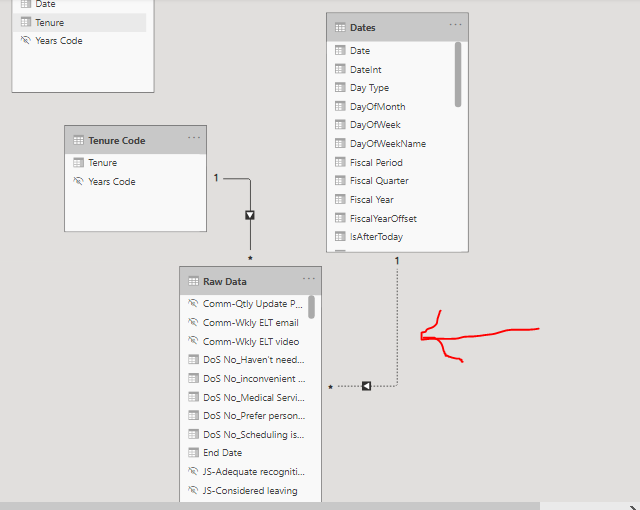
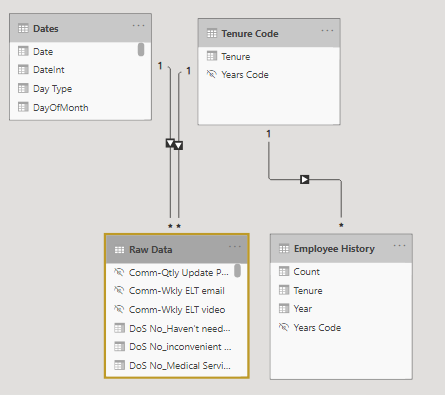
Attached is the model. The survey data is in the Raw Data table and there are relationships to a Dates table and a Tenure Code table. An Employee History table with counts by year and tenure is included, but no relationships has been created between the other tables.

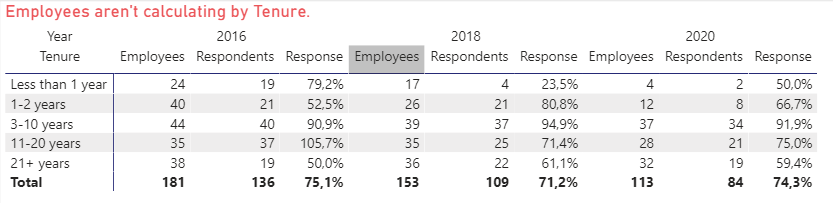
I’ve created a measure to get the employee counts by year. It calculates by year, but doesn’t break it out by tenure.

Employees =
CALCULATE (SUM (‘Employee History’[Count]),
TREATAS (VALUES (‘Employee History’[Tenure]),‘Tenure Code’[Tenure]),
TREATAS (VALUES (Dates [Date]),‘Employee History’[Date]))

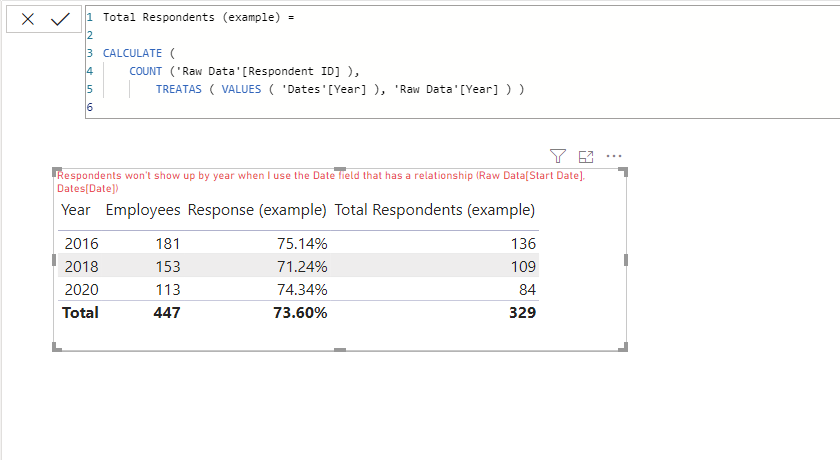
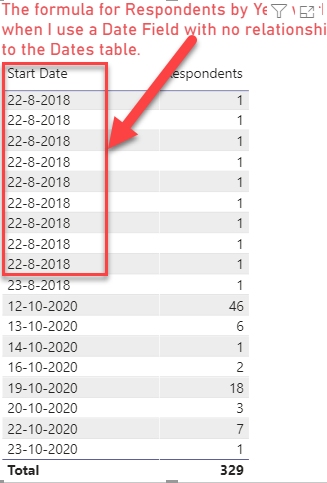
I can’t get a simple formula to count respondents by year using the established relationship between Raw Data and Dates. I’ve tried the following:

Total Respondents = COUNTROWS (‘Raw Data’)
OR
Total Respondents = COUNT (‘Raw Data’[Respondent ID])
OR
Total Respondents =
CALCULATE (COUNT (‘Raw Data’[Respondent ID]),
USERELATIONSHIP (‘Raw Data’[Start Date], Dates [Date]))

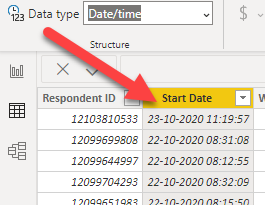
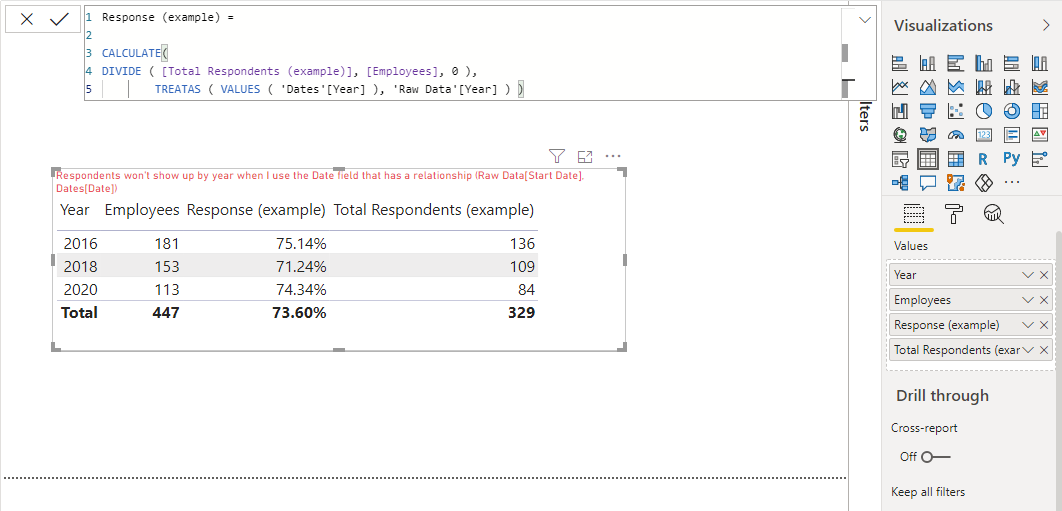
None of these are allowing me to show respondents by year when I select Year from the Date field. However, if I use a different date field [End Date] from the Raw Data table, I can create a visual that works as expected.

How can I modify the measure that will give me Employee counts by tenure group by year?

How can I modify the measure that will give me Respondents by tenure group by year?

These both need to work from a filter that uses the Dates table. The Respondents measure will be heavily used throughout the planned visuals.

Employee Survey - Enterprise DNA Help.pbix (395.4 KB)

Hi @npeterson,

You are experiencing issues because the granularity of your Date and Fact table don’t match.
The granularity of the Date table is at the Daily level whereas your Fact table is at the level of Seconds… you didn’t provide the data so go to Power Query, on the Transform tab select Date, Date Only.

Also please mark your Date table as a Date table and set the Year field to don’t summarize :+1:

image

I hope this is helpful

Hi @Melissa,

I’ve made the changes you suggested, but the formulas are still not working. What am I missing?

Employee Survey - Enterprise DNA Help.pbix (375.5 KB)

Hello @npeterson.

Thank you very much for this post with a very elaborate description.

I already confess that I did not like very well how I managed to solve this problem, so let’s analyze this solution together.

Disable the relationship between Dates and Raw Data.

Finally I applied the following code.

Total Respondents

Response

Best regards

Abel

Hi @npeterson,

Thanks for that swift action!

Noticed now that the Raw Data[Start Date] was a text value and not a type date - once I corrected that I got values for 2020 but not the other Years…
Closer inspection revealed that there is still an issue present for dates in 2016 and 2018. As you can see below these date values look the same but aren’t seen as a single date - would it be possible to supply a XLSX with the data so I can assist you with fixing that??

image

Thanks @Melissa and @Gifted. I’ve applied suggestions from both of you and now have most of the model working properly. But the Employees by Tenure calculation is still returning incorrect information. Can you take another look at the measure for Employees?
Employee Survey - Enterprise DNA Help.pbix (361.6 KB)

Hi @npeterson,

There is no reason not to have a relationship between Tunure and Emp History so I created that.
image

Made a slight adjustment to your measure:

Employees = 
    CALCULATE( SUM('Employee History'[Count]),
        FILTER( VALUES('Employee History'[Year]),
            'Employee History'[Year] IN VALUES(Dates[Year])
        )
    ) 

That seems to have resolved it

I hope this is helpful

Thank you @Melissa. This issue has been resolved :smiley:
Have a great day!!

1 Like