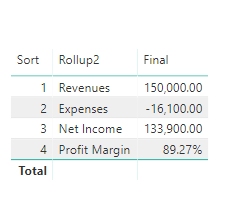
I was trying to create a simple P&L statement with Revenues, expenses, net income and Profit margin. I have actual detail table to extract data from and use the switch function to be able to show the required calculations as below. There a disconnected table for the format of the P&L.
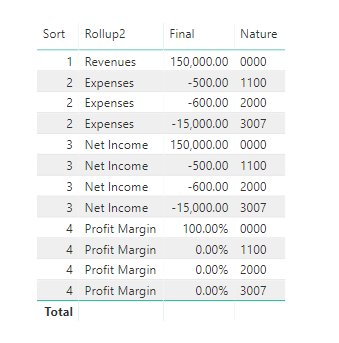
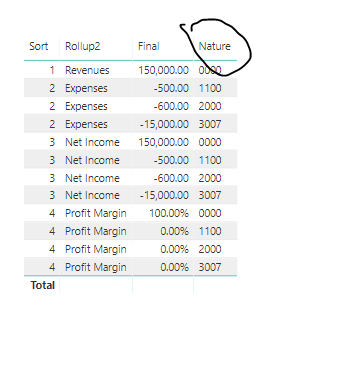
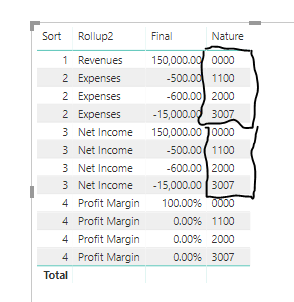
When I want to add a new column from actual table (Nature column) I get a problem with net income and profit margin calculation as below screen shot.
How can we solve this? I would like to create these kind of layouts with possible drill downs and keeping the measures correct. This will make the model I use very powerful in analysis and very useful in day to day work as an Financial Reporter.
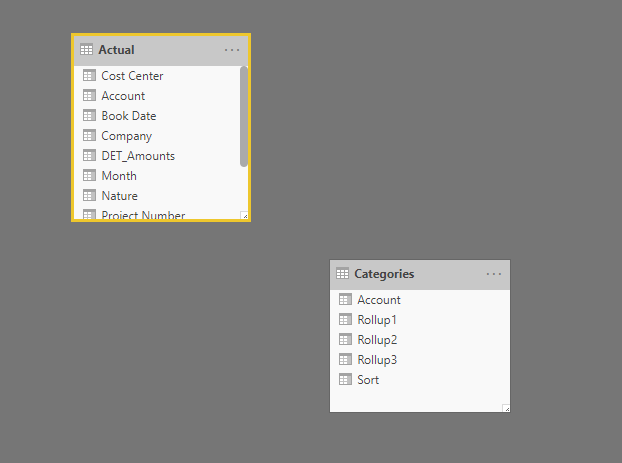
This is all about the context of the calculation when you add in the new column.
You have no relationship between the two tables so it has no idea what to do when this filter is place inside the table from that column
I’m interested to know what you were expecting to happen here?
I obviously don’t understand everything about the data, but I myself can’t really find any relevance of this column to the other columns in the visual? What are you actually aiming for here?
You see here with the Nature column your just getting a repeat of the numbers and the order they come in. There’s really nothing gained with this
I’m not really sure I have much else to add here other than to say this is simply a context issue. That particular column doesn’t know how to filter the results because it has no relationship to the other table columns you have in this particular report table.
Hopefully this can get you thinking deeper about what you are attempting to do here.
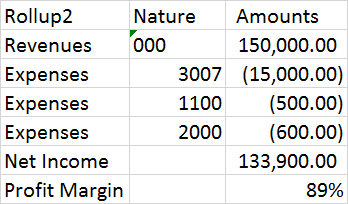
I want to see something as below once I drill down to nature.
Nature is simply another column in the table so the first view was just a summary view and I need to drill down to see the expenses by different nature codes.
If I create relationship I lose the profit margin calculation, it does not show. There may be a different way to get the required view, so I need your help and expertise.
I think in this specific case you probably want to create a template which has this specific layout in it, and then underlay this template to your results.
The way you were going about it initially was never going to work.
As you are looking to customize your table in a very specific way this is really the only option I think you have.
See below for what I mean about this.
I also detail this technique here during this workshop.
This is the road you need to go down here. You might not get specifically what you need, but there are some limitations to Power BI and customizing tables is one of them, unless you use this templating technique.
I reviewed the financial reporting template and that almost the same what I did using the table categories (as a template) in the powerbi file that I sent.
This works perfectly for a template of one dimension or column (my example rollup 2 field) in the template prepared and just use the switch function to get the Net income and profit margin. I however used switch function for all items and that was unnecessary as explained in your video. I need to use switch function for only the calculations such as Net income and Profit margin in my case.
I just need to add a second column in the template and that what I am stuck in.
If you see in the screen shot that expenses have to be repeated since it is broken down by a different dimension (nature). Is there a possibility to define the template this way and allocate the items to get the results in the screen shot.
I think the reality here is you need to build the template exactly how you want to show this here. There’s no simpler solution in Power BI right now other than this I don’t believe.
So you might not get exactly what you need with the dynamic rollup, but you’ll just have to create a template which suits the visual you ultimately need.