Hi everyone,
I’m working on a fairly basic problem. I’m trying to get a sales funnel (opportunity) dataset displayed in a table format.
I need to display the record count of the current and previous stage on a single row.
This would be done with a Lag function in other tools, but I have not found an easy way to do the same in Power BI.
I did some research and tried some techniques (filters, earlier() function, etc).
The closest solution uses a DAX measure that looks like this:
Opp. Drop off Rate =
VAR _CurrentStage = MAX(opp_history_with_stage_backfill[rank])
VAR _PreviousStage = _CurrentStage -1
VAR _CurrentCount = DISTINCTCOUNT(opp_history_with_stage_backfill[opportunity_id_18_dig__c])
VAR _DistOppCount = [Dist Opp Count]
VAR _PreviousCount =
IF(
_CurrentStage =1,
0,
CALCULATE(
DISTINCTCOUNT(opp_history_with_stage_backfill[opportunity_id_18_dig__c]),
FILTER(ALL(‘opp_history_with_stage_backfill’),‘opp_history_with_stage_backfill’[rank]=_PreviousStage)
)
)
RETURN
_PreviousCount
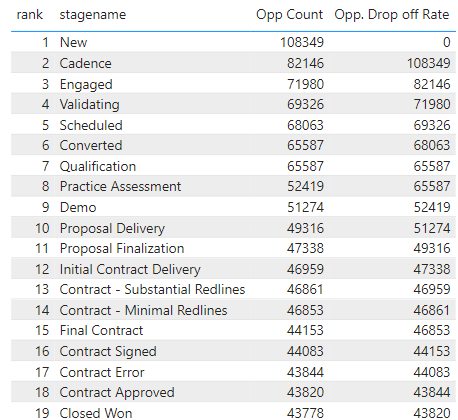
The issue with this that it doesn’t filter like the simple count measure (please see attached file).
Sorry about that, I meant the screenshot. I’ll have to clean up my file to be able to share it.
I was able to find a solution though for those that are interested.
The request was to display Salesforce Opportunity funnel stage drop off & counts in a table format.
All BI tools do a pretty good job with the visuals, but for raw table format, I needed to put the previous stage’s record count on the same row as the current stage record count was. Essentially this is a LAG function in SQL.
One of our BI tools (DOMO) is able to do this with a single line (their version of Measures is called Beast Mode):
so Previous Record Count = lag(COUNT(opportunityid), 1) over( order by rank asc )
In Power BI, I had to create a more complex measure to be able to display this info.
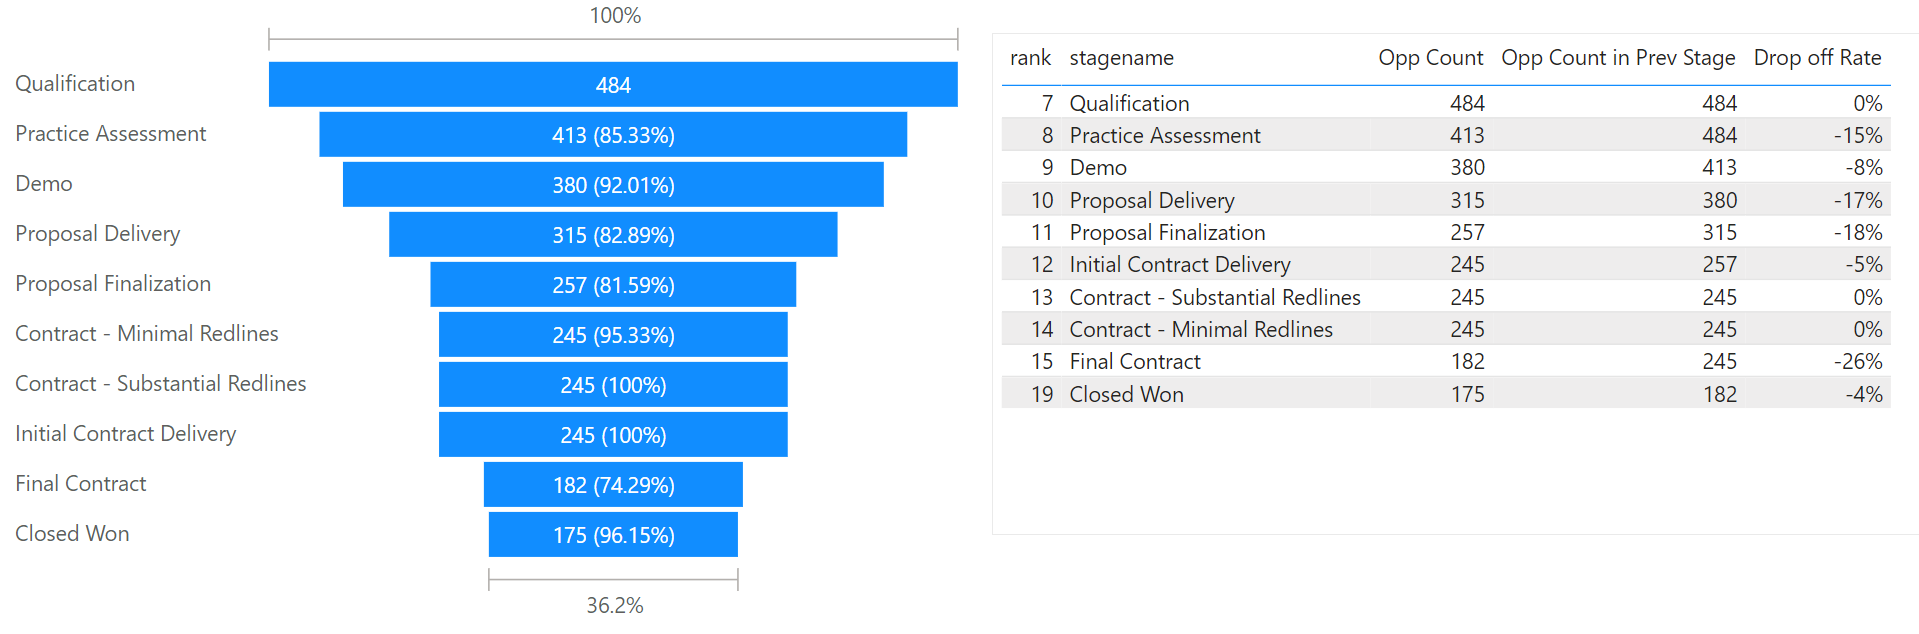
The solution was to apply the filter to the dimension vs. the fact table, so the visual would properly display both Opportunity Count and Opportunity Count for Previous Stage:
Opp. Drop off Rate test2 =
VAR _CurrentStage = MAX(opp_history_with_stage_backfill[rank])
VAR _PreviousStage = MAX(opp_history_with_stage_backfill[rank]) -1
VAR _CurrentCount = DISTINCTCOUNT(opp_history_with_stage_backfill[opportunity_id_18_dig__c])
VAR _PreviousCount =
IF(
_CurrentStage =1,
0,
CALCULATE(
DISTINCTCOUNT(opp_history_with_stage_backfill[opportunity_id_18_dig__c]),
FILTER(ALL(‘stage’),stage[rank]=_PreviousStage) // this filter is on the dimension table
)
)
RETURN
// DIVIDE(_CurrentCount-_PreviousCount,_PreviousCount,0
_PreviousCount
@HufferD Thank you very much for the suggestion! After cleaning up the model and looking at DAX, your suggestion made is extremely simple. Here is the formula that uses “measure branching”, piggy backing on simple measures to achieve the same result as SQL Lag in the DOMO solution: