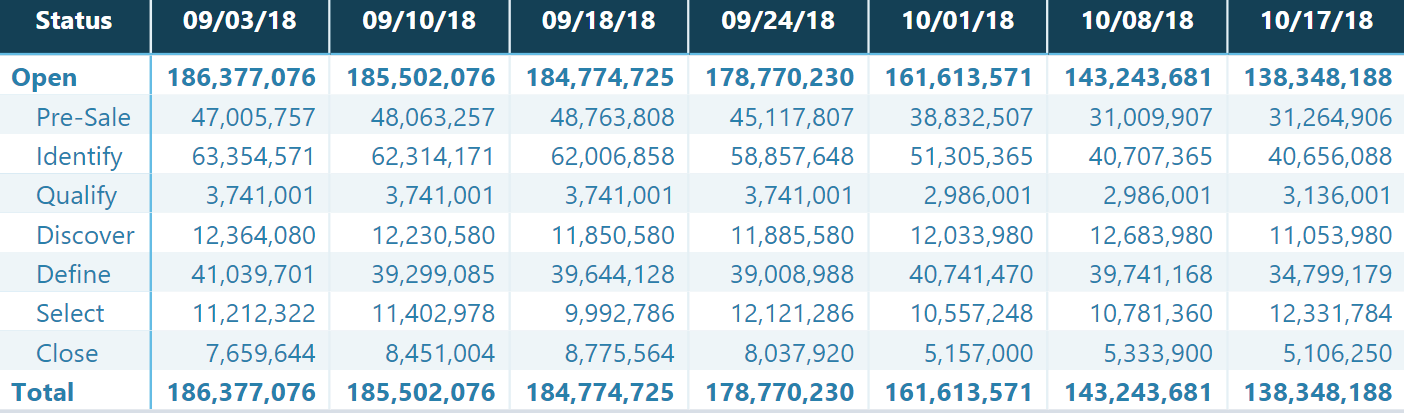
I need a measure that will calculate the difference between adjacent columns in a matrix. In the image below for example, I need to calculate the difference between 09/03/18 & 09/10/18, 09/10/18 & 09/18/18, 09/18/18 & 09/24/18, and so on. Please note that the number of days between dates is not even. It can be any number of days.
This is quite interesting and I think I know what the solution will be.
Check out this video it may help in terms of the technique used. You should be able to apply something similar to this.
If this doesn’t help is it possible to send through and example file to work on and test.
Thanks
2 Likes
Thank you so very much Sam! This is exactly what I was looking for. 

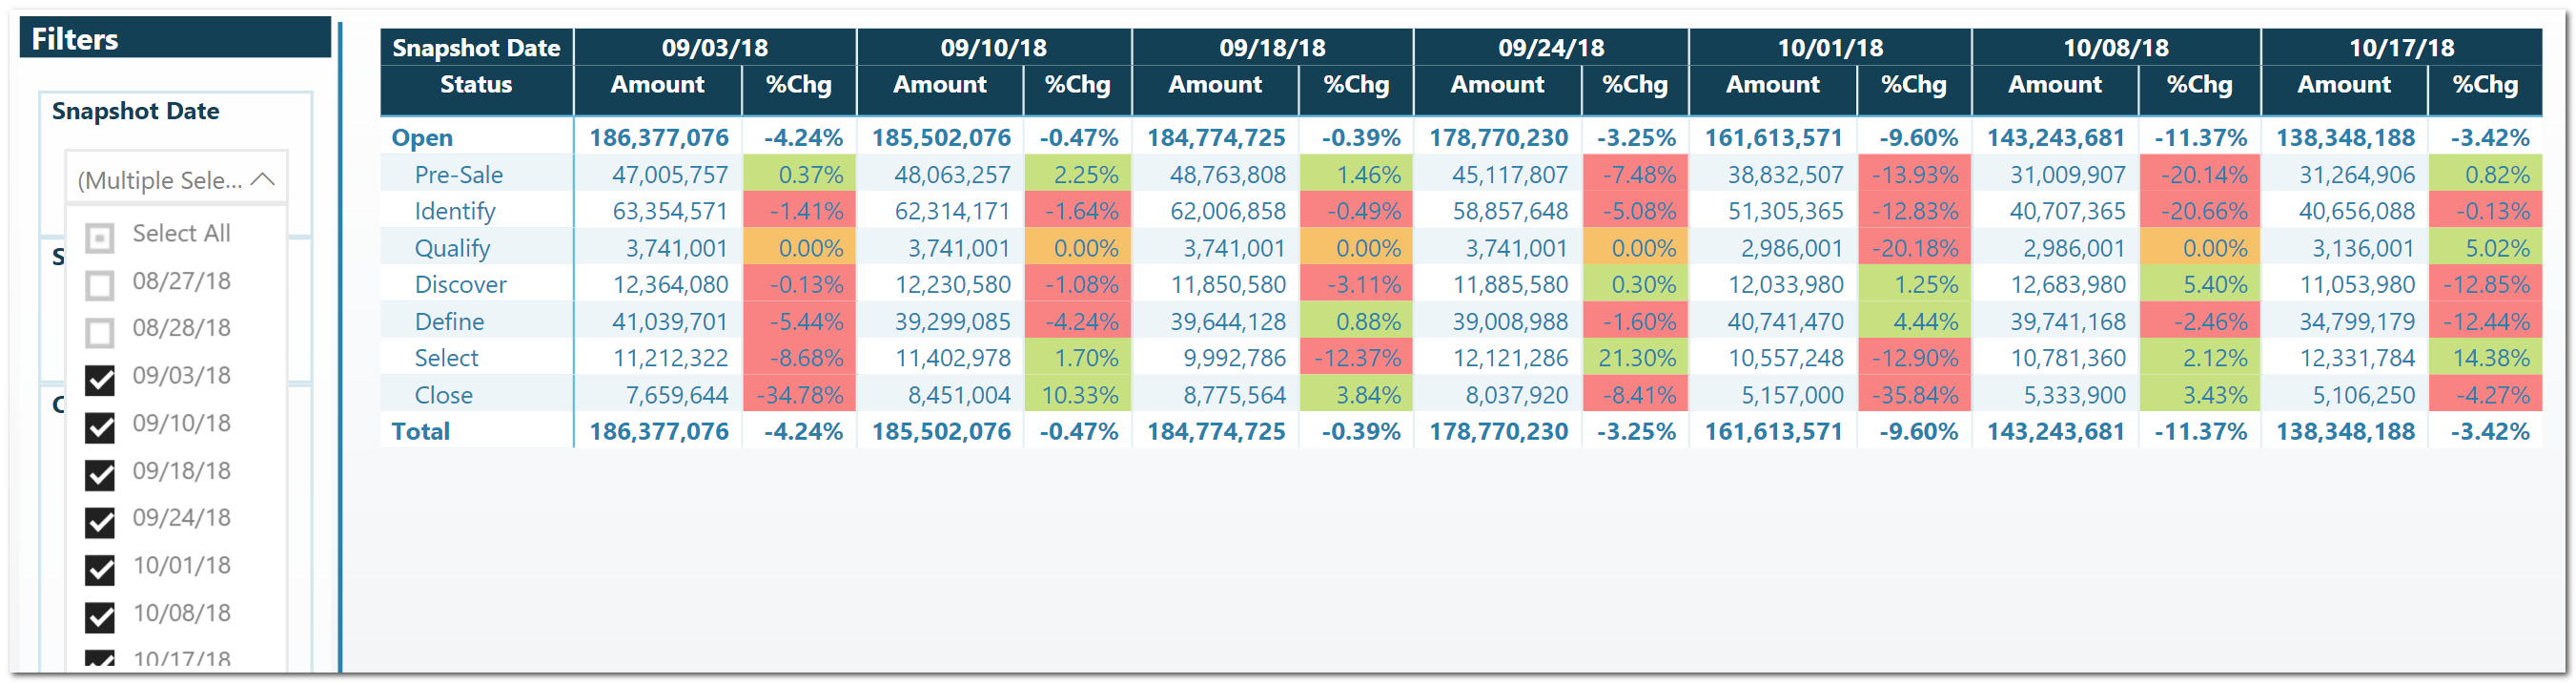
Hi Sam! Is it possible to modify the measure so that it respects the selected dates in the slicer? For example, in the image below, if I uncheck 09/10/18, I want the measure to compare 09/18/18 to 09/03/18. I’m aware that %Chg for the first value column (09/03/18) will be blank because there will be nothing to compare it to and that’s alright. That behavior is the same as in Excel pivot tables.
Yes nice one, glad you got it. That seems like the right way to go.