I’m looking for assistance on creating a measure. Each employee on a day by day level records there time to potentially 4 different codes. I’ve summarized the data by week. I have a measure which calculates the percent of time an employee has charge to each of these codes. This measure works at both the employee level and the week level (in a matrix visual).
I have a second measure where I’m identifying employees who’s time overall has been charged less than 70% to a specific code. Again this measure works as expected.
I need a 3rd measure based on the measure just above which gives me the details in a matrix visual for JUST the employees who’ve been identified in the measure above.
All the data in this model is sample data.
This measure also needs to be dynamic; meaning impacted by the slicers
Utilization-CommunityExample.pbix (457.2 KB)
on the page which filters to different periods.
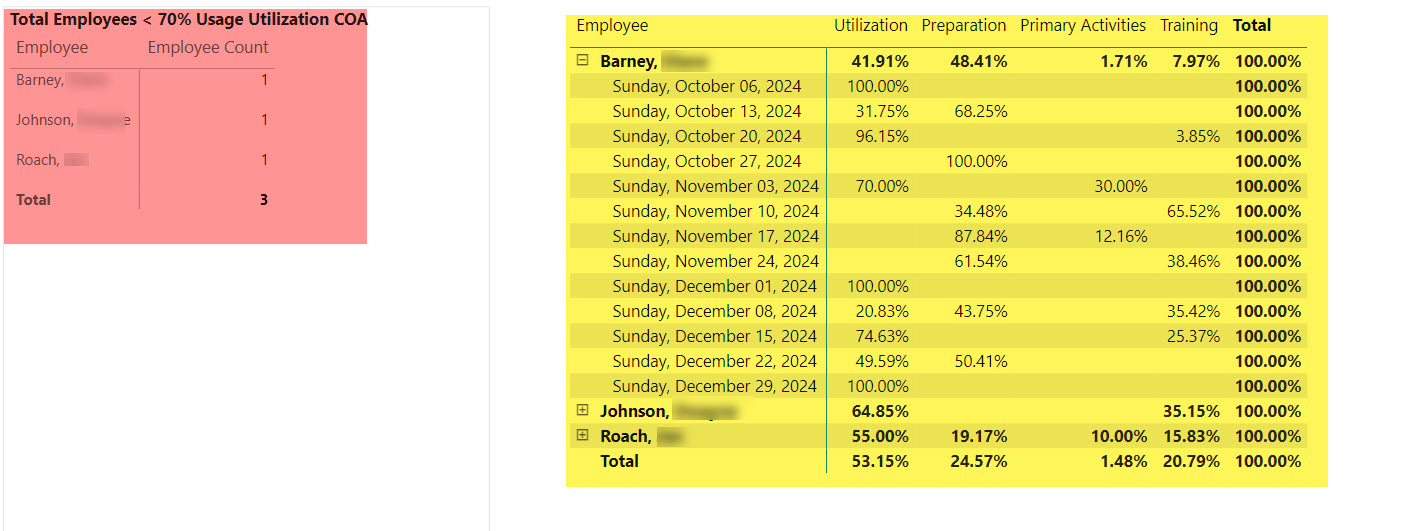
In the attached image, the highlight pink visual is what I already have, I need to get to the highlighted yellow visual with a measure.