I have an issue trying to create a measure that allows me to track the progress for our company’s projects and the related task levels involved with the project.
Dataset: The project management system we are using is called EasyProjects and we are loading a SSAS tabular model from an Azure SQL DB that has replicated data from the EP system.
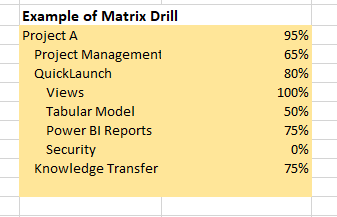
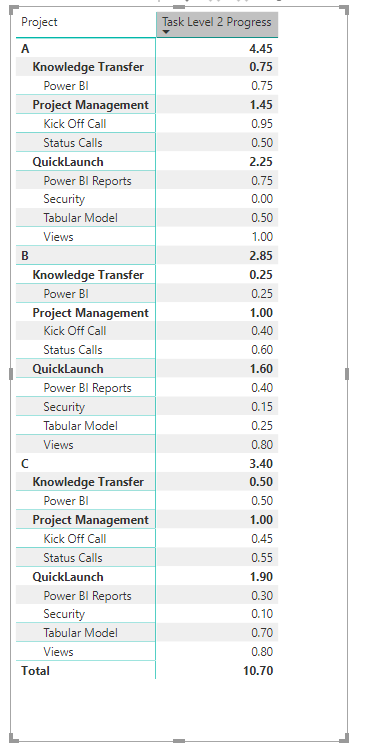
The problem: We would like to be able to drill from the project progress down to the different task level progress in a Power BI Matrix. Each Project has it is own progress metric (Project Progress). Within each project there is Task Level 1 and a corresponding progress for each task at this level (Task Level 1 Progress). Within Task Level 1 there is Task Level 2 with corresponding progress for those tasks as well (Task Level 2 Progress). Is there a way to construct a measure that can aggregate over this Parent Child relationship that will allow us to drill from the Project Progress down to Task Level 1 Progress and then to Task Level 2 Progress? I have attached a spread sheet that provides an example of the data model as well as the matrix we would like to create in PBI. Let me know if I can clarify anything else and thanks for all the help and great work on this site!
You know can also add images to the forum post which would be helpful to understand the scenario a bit better.
The best way to get assistance with this is to be more specific with the scenario you are facing within a Power BI model, or creating a demo model that can be reviewed.
My recommendation would be to work up the example in Power BI, begin working on your model and formulas you believe you need to solve your scenario, then we can help with adjustments you may need to get the answers you require.
Based on how you’ve described this so far, it doesn’t seem to difficult to create if your tables and model are setup correctly.
My understanding is you want to click from one level of the heirarchy down through to another. With the correct table setup this is very easy within Power BI.
Will likely need to see a demo to really assist here I believe as I can’t think of any further info that would be helpful at this point.
Thanks for the response. I created a simple PBIX file that hopefully will help.
I want to be able to drill from the Project to the Task Level 1 to the Task Level 2 and need to create a measure that evaluates the Project Progress and Task Level Progress values and displays the Progress value for whatever level in the hierarchy you are at.
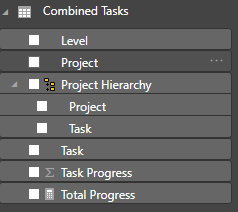
Not sure if this is an option for you or not, but what I would do is combine the tasks into one column, then create a hierachy from that column. That allows for easy drilldown
Reading your question again, I think I might have misunderstood. The other solution would be to break up the tasks into two separate tables. Then you could create a hierachy in the 3rd table that would allow drill down.
Thanks for the response Matthew. I don’t think that is going to work for us though.
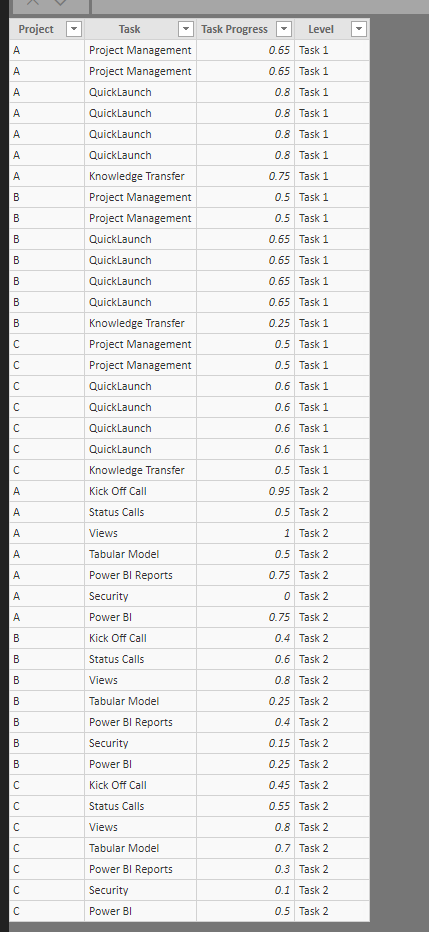
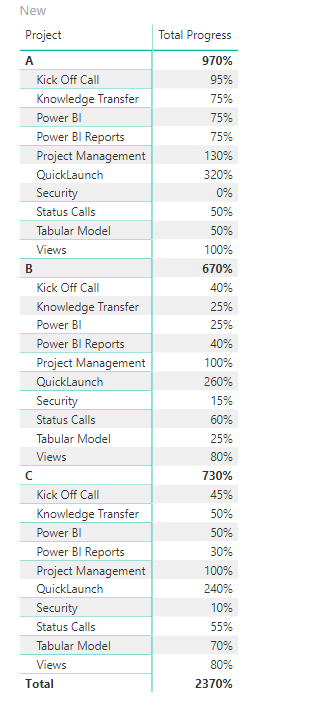
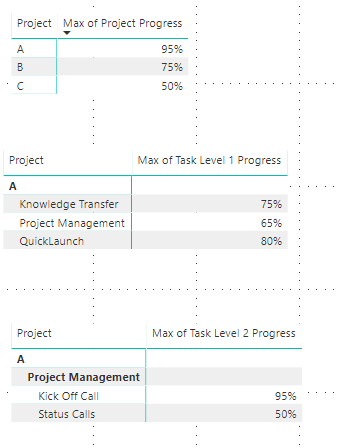
Getting the project and tasks into a drill-able hierarchy is not the problem. The problem is creating a Overall Progress (for lack of a better name) measure that works more like a switch statement. So when the matrix is displaying the first level of the hierarchy, Project, it is displaying the Project Progress. ie 50%. When the matrix is drilled down on to the second level, Task Level 1, the Overall Progress measure shows the Task Level 1 Progress values. These can be 0-100% based on whether or not that Task has been completed, etc. You would then be able to drill down to the third level of the hierarchy, Task Level 2 to see the corresponding progress values for Task Level 2 Progress. These also could be 0-100%. So basically depending on what the row context of the hierarchy is, we would like to display the corresponding progress value for that level.
So if you are at task level one, and take level two has three tasks, you want the progress meter for task one to be the min completed of the three task level two tasks?
No, if you are at task level one, the matrix would display the Task Level 1 Progress Value. If you are at Task Level 2, the matrix would display the value of Task Level 2 Progress. If you are at the Project level, the matrix would display the value for Project Progress. This is why it is more of a switch function measure than an aggregation (sorry my title is confusing). Also, please disregard the accuracy of the values for the progress fields, I just made up numbers for the sample data model. They are only there for illustration purposes)
Ok, I think I understand. You will still need to change the structure to allow hierarchies for drill down. Then you can probably use something like isfiltered