Measure not give the same result inside SWITCH

Hi fellow Power BI lovers,

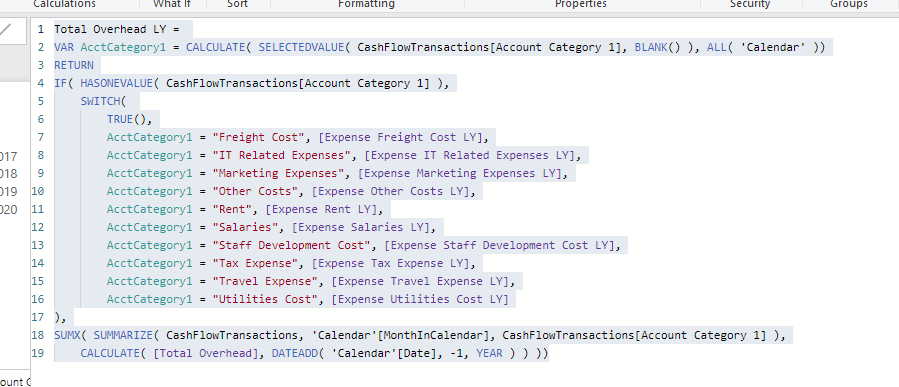
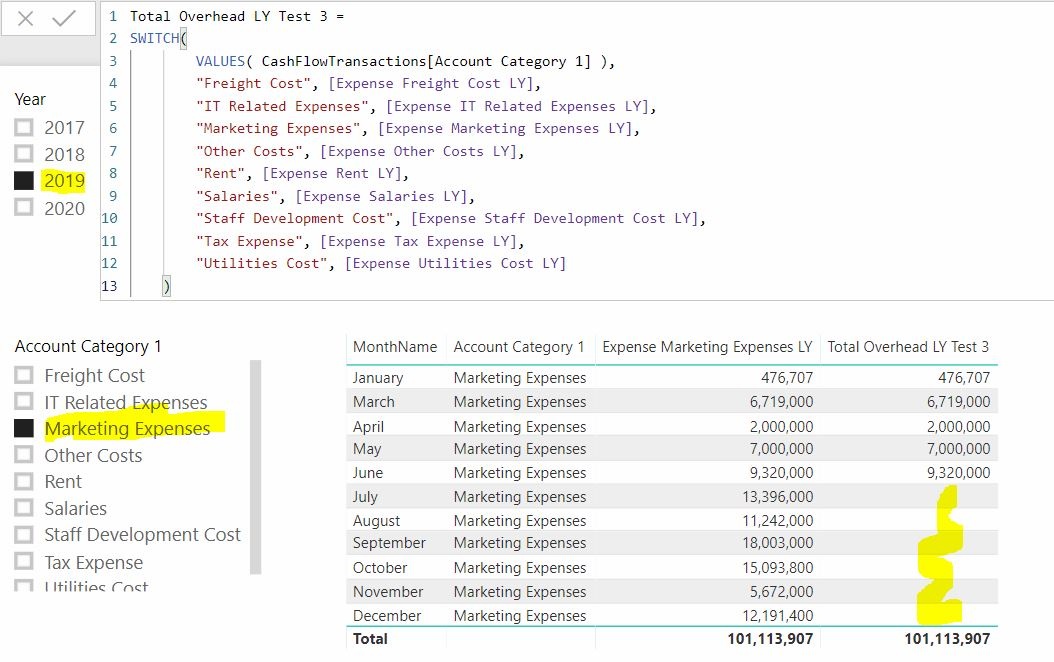
I’m trying to calculate individual cost items for last year. The year selected is 2019 so it should show 2018 results. I’d like to switch between the cost items hence used SWITCH function - please see the “Test 3” formula below.

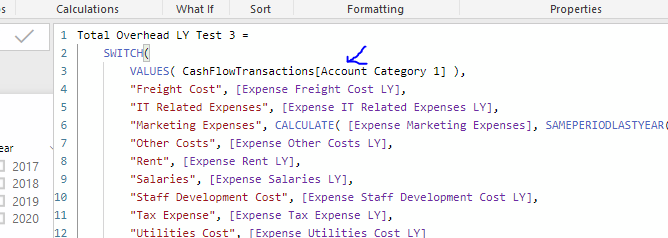
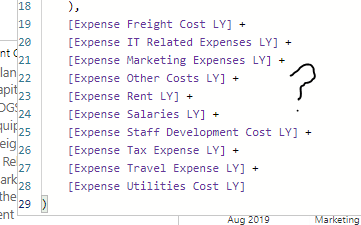
The Test 3 formula for your reference is:

Total Overhead LY Test 3 = 
SWITCH( 
VALUES( CashFlowTransactions[Account Category 1] ),
"Freight Cost", [Expense Freight Cost LY],
"IT Related Expenses", [Expense IT Related Expenses LY],
"Marketing Expenses", [Expense Marketing Expenses LY],
"Other Costs", [Expense Other Costs LY],
"Rent", [Expense Rent LY],
"Salaries", [Expense Salaries LY],
"Staff Development Cost", [Expense Staff Development Cost LY],
"Tax Expense", [Expense Tax Expense LY],
"Utilities Cost", [Expense Utilities Cost LY]
)

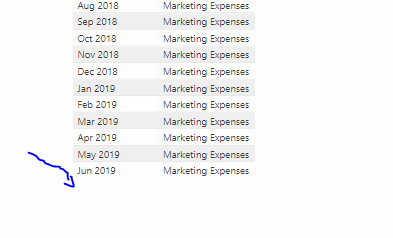
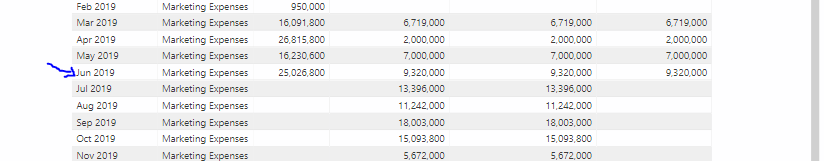
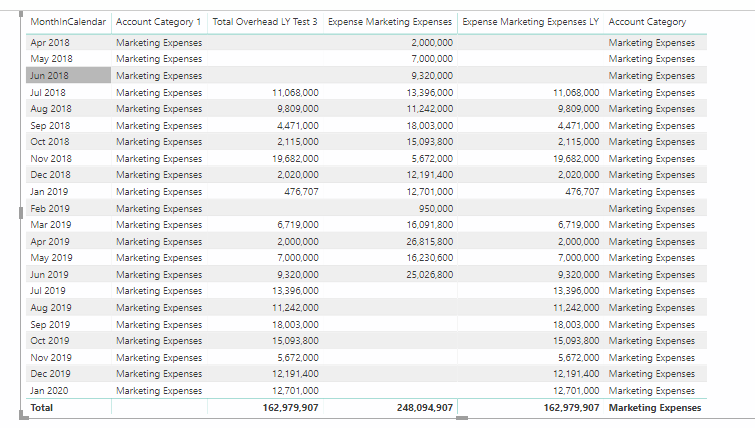
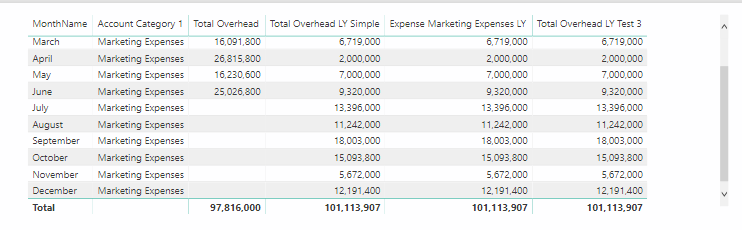
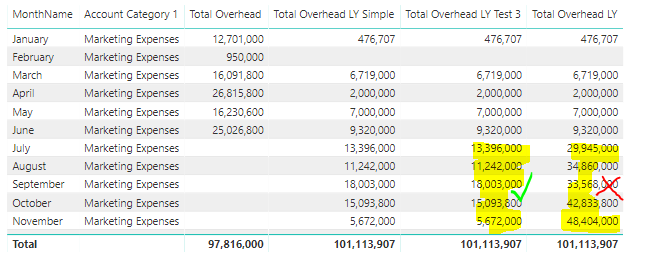
My problem is the Test 3 only shows the correct results up until June which is YTD month for this year, while all future months are blank. The individual cost item formula which used a simple DATEADD to shift back 1 year shows correct results for all future months.

Expense Marketing Expenses LY = 
CALCULATE(
[Expense Marketing Expenses],
DATEADD( 'Calendar'[Date], -1, YEAR )
)

Could you please advise what would have been wrong with my formula and suggest a possible solution?

Your advice would be much appreciated.

Could be a few things, any chance you can upload the file?

Thanks,

Enterprise%20DNA%20Expert%20-%20Small

Hi Nick,
Thanks for getting back to me. Please see attached the uploaded file.
Basically the related data model is just between the Calendar and CashFlowTransactions tables.

The measure in question is Total Overhead LY Test 3 in the Overhead Measures Table.

Hope you could have a solution… I’ve been scratching my head for 3 days now… :slight_smile:Overhead Measures.pbix (672.5 KB)

Cheers.

Have had a quick look through here…all I can put it down to is the VALUES part of the formula.

I tested a few things to see why and you’ll see here that if you only have this column against a column from the date table then it ends at June 2019, so it is only evaluating to true up to that point.

image

image

You’ll need some other piece of logic there. Something like the below.

Total Overhead LY Test 3 = 
VAR AcctCategory = CALCULATE( SELECTEDVALUE( CashFlowTransactions[Account Category 1], BLANK() ), ALL( 'Calendar' ) )

RETURN
    SWITCH( 
        TRUE(),
        AcctCategory = "Freight Cost", [Expense Freight Cost LY],
        AcctCategory = "IT Related Expenses", [Expense IT Related Expenses LY],
        AcctCategory = "Marketing Expenses", [Expense Marketing Expenses LY],
        AcctCategory = "Other Costs", [Expense Other Costs LY],
        AcctCategory = "Rent", [Expense Rent LY],
        AcctCategory = "Salaries", [Expense Salaries LY],
        AcctCategory = "Staff Development Cost", [Expense Staff Development Cost LY],
        AcctCategory = "Tax Expense", [Expense Tax Expense LY],
        AcctCategory = "Utilities Cost", [Expense Utilities Cost LY],
    BLANK()
    )

You’ll see I need to use the ALL( Calendar ) inside CALCULATE, because the Account Category column was always ending at June and it needed to be down across all dates for the formula to work as you needed.

I tested a few things before I landed on the right answer.

Sam

I have successfully tried your formula! Thanks a lot for your quick turnaround! :slightly_smiling_face:

On the same data model, I took a step further and tried to calculate the total overhead amount. Basically I’m trying to say if there’s not selection in the Account Category 1, please return the total amount. However, it distorted the future months for Marketing Expenses.

image

Total Overhead LY = 
VAR AcctCategory1 = CALCULATE( SELECTEDVALUE( CashFlowTransactions[Account Category 1], BLANK() ), ALL( 'Calendar' ))
RETURN
IF(
    HASONEVALUE( CashFlowTransactions[Account Category 1] ),
    SWITCH( 
        TRUE(),
        AcctCategory1 = "Freight Cost", [Expense Freight Cost LY],
        AcctCategory1 = "IT Related Expenses", [Expense IT Related Expenses LY],
        AcctCategory1 = "Marketing Expenses", [Expense Marketing Expenses LY],
        AcctCategory1 = "Other Costs", [Expense Other Costs LY],
        AcctCategory1 = "Rent", [Expense Rent LY],
        AcctCategory1 = "Salaries", [Expense Salaries LY],
        AcctCategory1 = "Staff Development Cost", [Expense Staff Development Cost LY],
        AcctCategory1 = "Tax Expense", [Expense Tax Expense LY],
        AcctCategory1 = "Travel Expense", [Expense Travel Expense LY],
        AcctCategory1 = "Utilities Cost", [Expense Utilities Cost LY]
    ),
    [Expense Freight Cost LY] +
    [Expense IT Related Expenses LY] +
    [Expense Marketing Expenses LY] +
    [Expense Other Costs LY] +
    [Expense Rent LY] +
    [Expense Salaries LY] +
    [Expense Staff Development Cost LY] +
    [Expense Tax Expense LY] +
    [Expense Travel Expense LY] +
    [Expense Utilities Cost LY]
)

Could you please advise? Thanks.

I just tried to simplify things here, so I can really drill down into the issue.

I also place in the MonthnCalendar dimension as well so I could see all the results.

One thing I’m confused about it why do you think you need all this. The total naturally changes when the context is changed from the slicer.

image

Use something like this instead for the total.

Total Overhead LY = 
VAR AcctCategory1 = CALCULATE( SELECTEDVALUE( CashFlowTransactions[Account Category 1], BLANK() ), ALL( 'Calendar' ))
RETURN
IF( HASONEVALUE( CashFlowTransactions[Account Category 1] ),
    SWITCH( 
        TRUE(),
        AcctCategory1 = "Freight Cost", [Expense Freight Cost LY],
        AcctCategory1 = "IT Related Expenses", [Expense IT Related Expenses LY],
        AcctCategory1 = "Marketing Expenses", [Expense Marketing Expenses LY],
        AcctCategory1 = "Other Costs", [Expense Other Costs LY],
        AcctCategory1 = "Rent", [Expense Rent LY],
        AcctCategory1 = "Salaries", [Expense Salaries LY],
        AcctCategory1 = "Staff Development Cost", [Expense Staff Development Cost LY],
        AcctCategory1 = "Tax Expense", [Expense Tax Expense LY],
        AcctCategory1 = "Travel Expense", [Expense Travel Expense LY],
        AcctCategory1 = "Utilities Cost", [Expense Utilities Cost LY]
),
SUMX( SUMMARIZE( CashFlowTransactions, 'Calendar'[MonthInCalendar], CashFlowTransactions[Account Category 1] ),
    CALCULATE( [Total Overhead], DATEADD( 'Calendar'[Date], -1, YEAR ) ) ))

With totals you need to usually create an iteration that will go through every value and aggregate them up all virtually.

I’m not sure if this give the right answer, but it definitely fixes the in table numbers and the total is different

Thanks
Sam

Thanks a lot. I may have over-complicated it - just thought as I got all the individual expense measures for LY already so just added them up together.
Your formula works perfectly! Thanks so much on spending time helping solving the problem.

Hi,

I’ve just recalled why I did the total as a sum of individual cost element measures - I just lost my train of thoughts thinking about the formula. The purpose is to create a budget by applying different multipliers to different overhead elements.
For example, Marketing * 3 while Salary *2 etc.
I changed the “Hasonevalue” to “Hasonefilter” and it gave the correct results.

Cheers.