Hi,
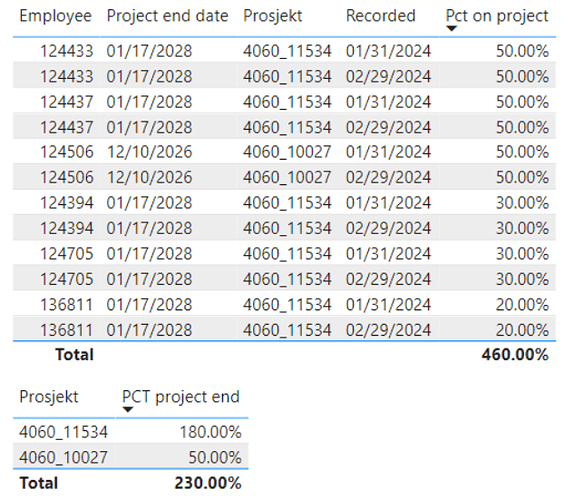
I’m working on a model that will show the pct each of our employees are working on a project. It is important to have an overview of how many percenct they are working on a current project (externally funded) and when the project ends. At the end of each month I get a file from HR showing the amount of workload allocated to various projects. I add the new files in PowerQuery and append it to my fact table. As you can see from the table below, this results in multiple rows for each employee and project based on the “recorderd” coloumn (which represenst the date I get new data from HR).
| Employee | Pct on project | Prosjekt | Recorded | Project end date |
|---|---|---|---|---|
| 124506 | 50 % | 4060_10027 | 31.01.2024 | 10.12.2026 |
| 124506 | 50 % | 4060_10027 | 29.02.2024 | 10.12.2026 |
| 124394 | 30 % | 4060_11534 | 31.01.2024 | 17.01.2028 |
| 124394 | 30 % | 4060_11534 | 29.02.2024 | 17.01.2028 |
| 124433 | 50 % | 4060_11534 | 31.01.2024 | 17.01.2028 |
| 124433 | 50 % | 4060_11534 | 29.02.2024 | 17.01.2028 |
| 124437 | 50 % | 4060_11534 | 31.01.2024 | 17.01.2028 |
| 124437 | 50 % | 4060_11534 | 29.02.2024 | 17.01.2028 |
| 124705 | 30 % | 4060_11534 | 31.01.2024 | 17.01.2028 |
| 124705 | 30 % | 4060_11534 | 29.02.2024 | 17.01.2028 |
| 136811 | 20 % | 4060_11534 | 31.01.2024 | 17.01.2028 |
| 136811 | 20 % | 4060_11534 | 29.02.2024 | 17.01.2028 |
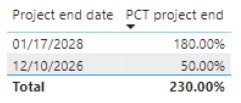
I have tried to make a calculation to show the pct on project for each year that projects end. If I do a simple SUM(Table[Pct on project]), I will not get the correct result since each employee will be present at several times in the table. What Im trying to do is to find a way to calculate pct on project for the project end dates, but only based on the latest date in the Recorded coloumn.
What I expect as result is thiis:
| Project end date | Prosjekt | Pct on project |
|---|---|---|
| 17.01.2028 | 4060_10027 | 50 % |
| 10.12.2026 | 4060_11534 | 180 % |
I have set my model up as a star schema, and I have a date-table (DateDim). However the DateDim has an active relationship with the “Recorded”-coloumn in the fact table, since Im also calculating total pct on projects for each month. Thus I have an inactive relationship between my DateDim and “Project end date”. If I create a Slicer for “Recorded” and select the latest date, I get the correct outcome in my visualisation. However, I dont want to have to come in and change the slicer everytime there is an update, thus I want a measure that will handle this for my. I tried a couple of formulas without success:
PCT project end =

Var _PCTend =
    CALCULATE(SUM('Fact'[Pct on project]),
    USERELATIONSHIP(DateDim[Date], 'Fact'[Project end date] )
    )

Return
CALCULATE(_PCTend,
   FILTER('Fact', 'Fact'[Recorded]=DATE(2024, 02, 29) ) )
PCT project end =

Var _PCTend =
    CALCULATE(SUM('Fact'[Pct on project]),
    USERELATIONSHIP(DateDim[Date], 'Fact'[Project end date] )
    )

Return
CALCULATE(_PCTend,
   FILTER(ALL('Fact', MAX('Fact'[Recorded]) ) )
PCT project end =

Var _PCTend =
    CALCULATE(SUM('Fact'[Pct on project]),
    USERELATIONSHIP(DateDim[Date], 'Fact'[Project end date] )
    )

Return
CALCULATE(_PCTend,
   FILTER('Fact', LASTDATE('Fact'[Recorded]) ) )
If someone has any tips, it will be much appreciated.
Please let me know if something is unclear, and I will try to explain further.
Best,
Magnus

