Hi, I have created a measure which calculates %. Now I would like to create a slicer which has values “above 80%”,“above 70-80”, “below 70”. Then based on my selection visual table should be filtered. If I select “above 80%” in slicer, then table view or any visuals on the report should be filtered based on my slicer values. Please advice, how this can be achieved.
Thanks
Power BI does not support slicing based on measures (there are some clever workarounds in limited cases, but I don’t think they will work here). Thus, you will need to create a calculated column, which probably best can be done using a SWITCH(TRUE() ) construct given your scenario.
The exact details of how best to do this will depend on the specifics of your data model, so if you could please post your PBIX file, that would help us provide the most specific solution to you.
Thanks.
- Brian

Hi, due to data sensitivity, I am not able to share my file. I can give an example.
|Student |Maths |Physics|Chemistry|Total|%| , out of 300 marks student 1 got 50%.
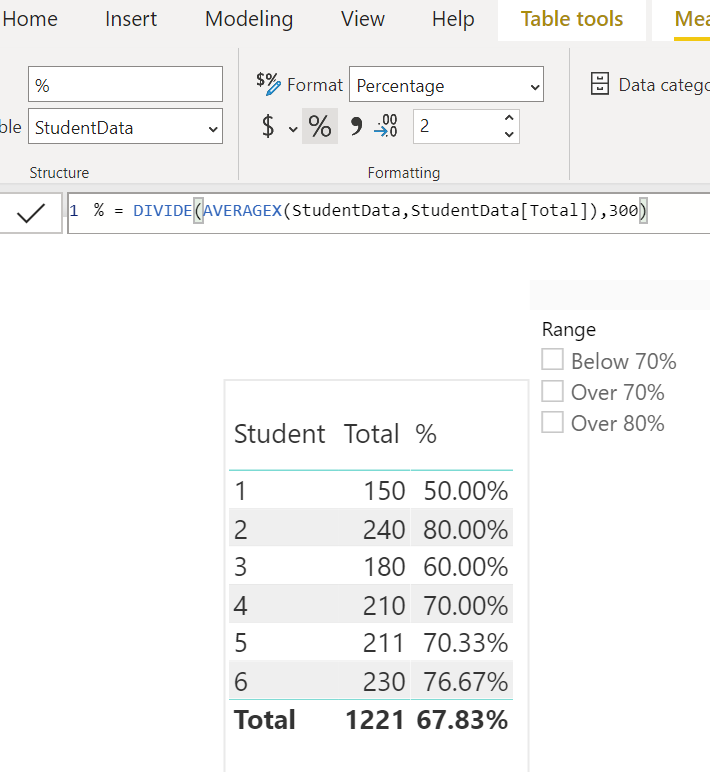
% column is a measure in Power BI
|1|50|50|50|150|50%|
|2|80|80|80|240|80%|
|3|60|60|60|180|60%|
|4|70|70|70|210|70%|
|5|60|85|66|211|70%|
|6|70|90|70|230|77%|
In slicer I want to have “Over 80%”, “Over 70%”, “Below 70%”
Please advice. Thanks
Hi @dratan99,
Check out the dynamic grouping article and related content.
I think you will find it helpful.
Hi @dratan99,
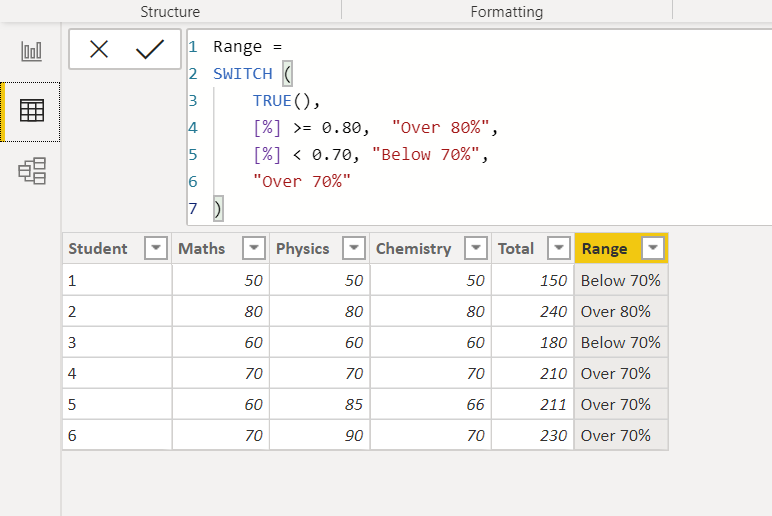
For slicer you must use calculated column. Below is the code you can use to generate the range.
Range =
SWITCH (
    TRUE(),
    [%] >= 0.80,  "Over 80%",
    [%] < 0.70, "Below 70%",
    "Over 70%"
)
Under Data tab you create calculated column.
On the report tab you can see the % and the slicer.
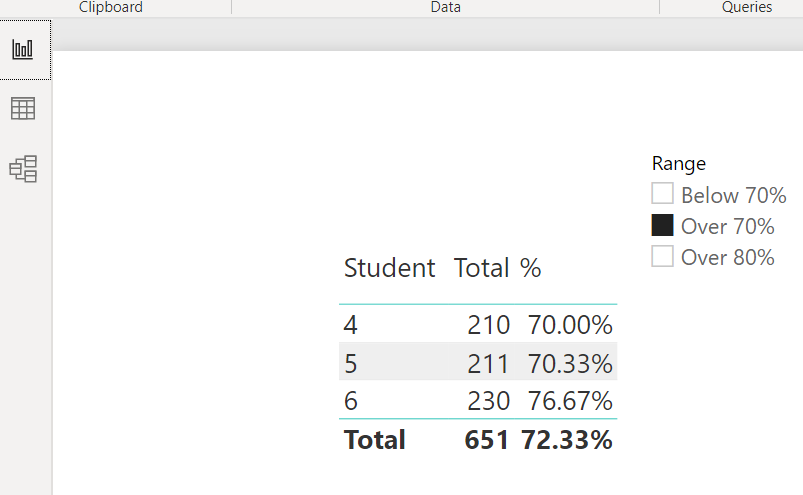
Slicer working demo…
Hi @dratan99 , did the response provided by our Experts help you solve your query? If not, how far did you get and what kind of help you need further? If yes, kindly mark the thread as solved. Thanks!
Hi, I tried using your solution no luck yet. I think some issue with my data. I will give a try again and let you know. Thanks
1 Like
If you’re still having problems, you can use the following techniques to quickly anonymize your data. I guarantee if you’re able to post a PBIX file you’ll get a quick, specific solution on this (and probably more than one…)

- Brian
Thanks for posting your question @dratan99. To receive a resolution in a timely manner and a specific solution to your query please make sure that you provide all the necessary details on this thread.
Here is a potential list of additional information to include in this thread; demo pbix file, images of the entire scenario you are dealing with, screenshot of the data model, details of how you want to visualize a result, and any other supporting links and details.
Including all of the above will likely enable a quick solution to your question.
Hi @dratan99, we’ve noticed that no response has been received from you since the 18th of September. We just want to check if you still need further help with this post? In case there won’t be any activity on it in the next few days, we’ll be tagging this post as Solved. If you have a follow question or concern related to this topic, please remove the Solution tag first by clicking the three dots beside Reply and then untick the checkbox. Thanks!