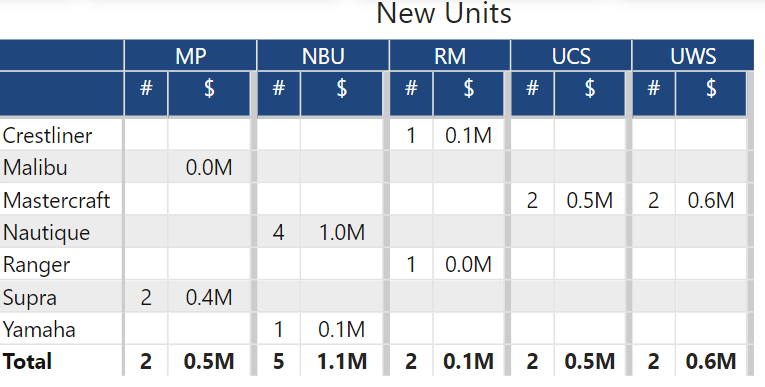
Is there a Deneb template which someone could share for creating a matrix with Deneb? In the attached screen shot I have 5 stores. The matrix shows the number and dollar total sold by product. I also would like to show row and column totals. There needs to be a visual spacer between stores, which is something Power BI lacks in the matrix visualization. You can add a spacer as a metric but I’ve encountered glitches with how it reacts with the total column. Thank you for any help you can provide.
Hi @lancemillercpa98. There was a YouTube released by Greg Deckler a while ago on totals in matrices using Deneb … not sure if it’s what you’re looking for.

If you’d welcome further investigation, while you’ve provided a target outcome (thanks), please as well upload a dataset and work-in-progress PBIX file with a standard native table visual that can be used as a starting point for continued Deneb investigation.
Greg
Thank you Greg! Linked is the pbix.
https://lancemillercpa-my.sharepoint.com/:u:/g/personal/lance_lancemillercpa_onmicrosoft_com/EcDN5rIWPn1HiFzsteMYlpkBx4EnaK2D6-6x3ftqIOTh2w?e=N95clM
Questions:
- How to format individual metrics passed into measures (millions, %, etc.)?
- How to add a light gray background to every other row?
- How to group by store (columns)?
- How to add a separator between stores, as done with gray bar in Power BI Matrix?
- How to add row and column totals? This is probably too much to ask. I tried to follow Greg Deckler’s example and was overwhelmed. I wish he had included a link to the PBIX.
Thank you so much for your help!
This is the first time I’ve tried a multi-level table/matrix in Deneb/Vega-Lite, so am submitting my work-in-progress. Here, I’ve created the shell and raw contents of the matrix by adding a facet for store and including a fold transform inside the spec block. For the totals, add a 2nd text mark inside the layer block at a fixed Y position and use a sum aggregation.
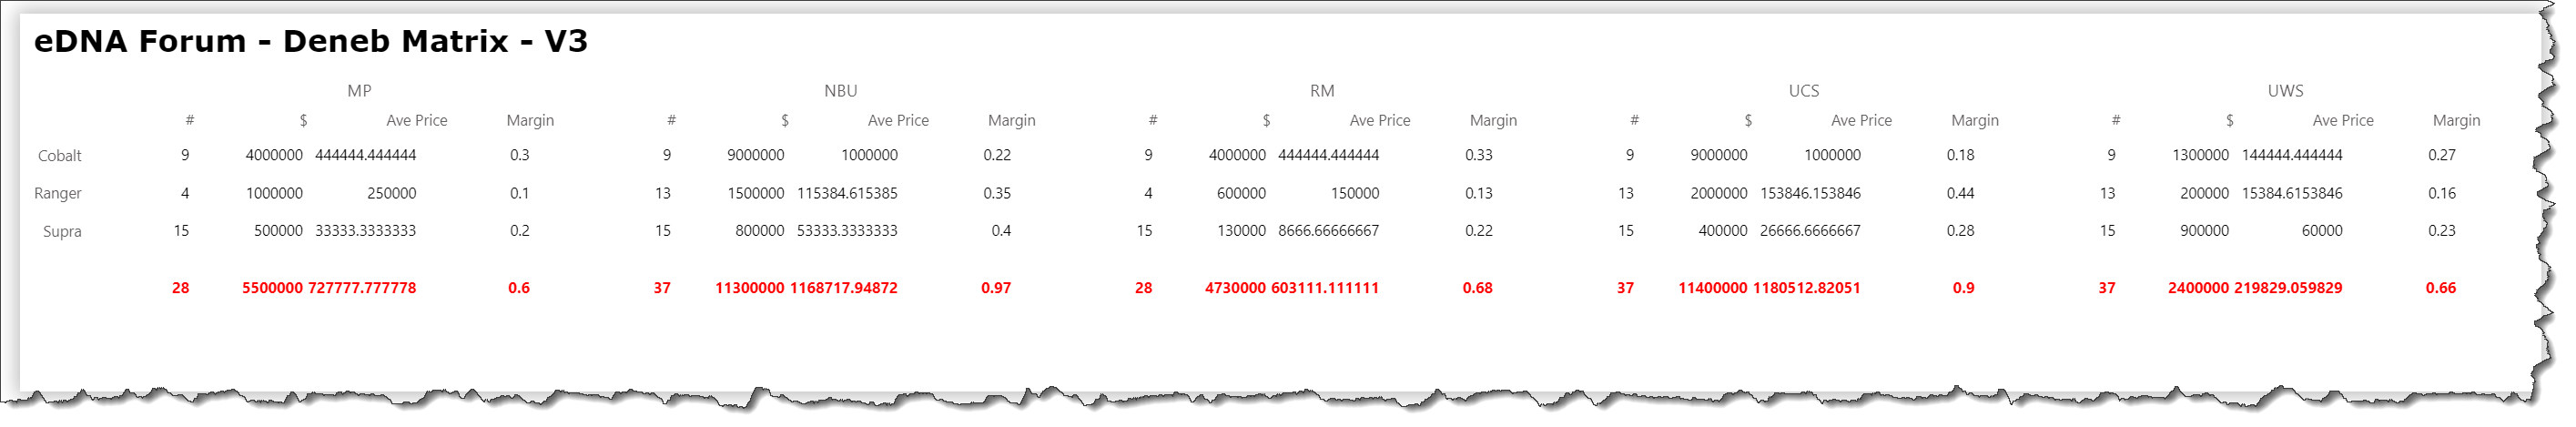
My first couple of attempts at formatting the matrix contents have not been successful, and I’ll post again when progress is made or a solution is found.
Here’s the code:
{
  "title": {
    "text": "eDNA Forum - Deneb Matrix - V3",
    "anchor": "start",
    "font": "Verdana",
    "fontSize": 24,
    "offset": 20
  },
  "data": {"name": "dataset"},
  "facet": {
    "column": {
      "field": "Store",
      "title": null
    }
  },
  "spec": {
    "width": 360,
    "height": {"step": 30},
    "transform": [
      {
        "fold": [
          "#",
          "$",
          "Ave Price",
          "Margin"
        ],
        "as": [
          "_metric_name",
          "_metric_value"
        ]
      }
    ],
    "layer": [
      {
        "name": "CELL_VALUE",
        "mark": {
          "type": "text",
          "align": "right",
          "color": "black"
        },
        "encoding": {
          "x": {
            "field": "_metric_name",
            "type": "nominal",
            "axis": {"title": null}
          },
          "y": {
            "field": "Make",
            "type": "nominal",
            "axis": {"title": null}
          },
          "text": {
            "field": "_metric_value",
            "type": "quantitative"
          }
        }
      },
      {
        "name": "TOTAL_VALUE",
        "mark": {
          "type": "text",
          "align": "right",
          "fontWeight": "bold",
          "y": 120,
          "color": "red"
        },
        "encoding": {
          "x": {
            "field": "_metric_name",
            "type": "nominal",
            "axis": {"title": null}
          },
          "text": {
            "aggregate": "sum",
            "field": "_metric_value",
            "type": "quantitative"
          }
        }
      }
    ]
  }
}
Hope it helps.
Greg
eDNA Forum - Deneb Matrix - V3.pbix (1.6 MB)
I had another thought on the formatting which partially works: calculate the formatted value as text in advance in the transform block and use it instead of the raw value in the text mark.
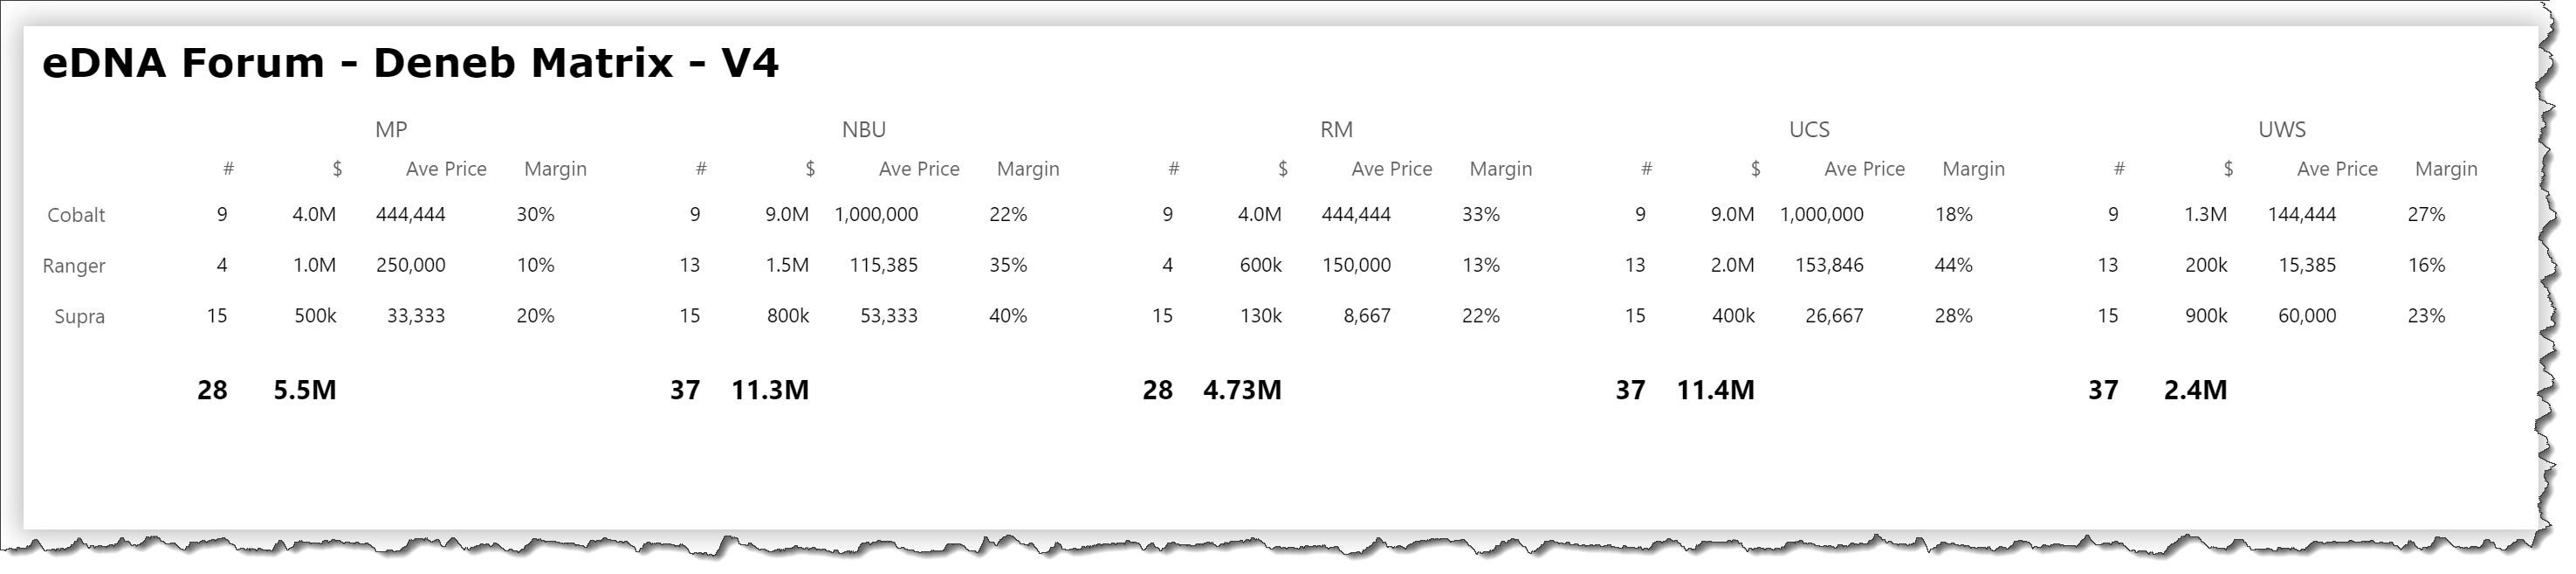
I only included totals for the [#] and [$] columns as the other two aren’t additive.
Here’s the code:
{
  "title": {
    "text": "eDNA Forum - Deneb Matrix - V4",
    "anchor": "start",
    "font": "Verdana",
    "fontSize": 24,
    "offset": 20
  },
  "data": {"name": "dataset"},
  "facet": {
    "column": {
      "field": "Store",
      "title": null
    }
  },
  "spec": {
    "width": 260,
    "height": {"step": 30},
    "transform": [
      {
        "fold": [
          "#",
          "$",
          "Ave Price",
          "Margin"
        ],
        "as": [
          "_metric_name",
          "_metric_value"
        ]
      },
      {
        "calculate": "if( datum['_metric_name'] == '$', format( datum['_metric_value'], ',.2s'), if( datum['_metric_name'] == 'Ave Price', format( datum['_metric_value'], ',.0f'), if( datum['_metric_name'] == 'Margin', format( datum['_metric_value'], '.0%'), datum['_metric_value'] ) ) )",
        "as": "_metric_value_formatted"
      }
    ],
    "layer": [
      {
        "name": "CELL_VALUE",
        "mark": {
          "type": "text",
          "align": "right",
          "color": "black",
          "tooltip": {"content": "data"}
        },
        "encoding": {
          "x": {
            "field": "_metric_name",
            "type": "nominal",
            "axis": {"title": null}
          },
          "y": {
            "field": "Make",
            "type": "nominal",
            "axis": {"title": null}
          },
          "text": {
            "field": "_metric_value_formatted",
            "type": "nominal"
          }
        }
      },
      {
        "name": "TOTAL_VALUE",
        "transform": [
          {
            "filter": "datum['_metric_name'] == '#' || datum['_metric_name'] == '$'"
          },
          {
            "aggregate": [
              {
                "op": "sum",
                "field": "_metric_value",
                "as": "_metric_value_sum"
              }
            ],
            "groupby": ["_metric_name"]
          },
          {
            "calculate": "if( datum['_metric_name'] == '$', format( datum['_metric_value_sum'], ',.3~s'), if( datum['_metric_name'] == 'Ave Price', format( datum['_metric_value_sum'], ',.0f'), if( datum['_metric_name'] == 'Margin', format( datum['_metric_value_sum'], '.0%'), datum['_metric_value_sum'] ) ) )",
            "as": "_metric_value_formatted2"
          }
        ],
        "mark": {
          "type": "text",
          "align": "right",
          "fontSize": 16,
          "fontWeight": "bold",
          "y": 120,
          "color": "black"
        },
        "encoding": {
          "x": {
            "field": "_metric_name",
            "type": "nominal",
            "axis": {"title": null}
          },
          "text": {
            "field": "_metric_value_formatted2",
            "type": "nominal"
          }
        }
      }
    ]
  }
}
Hope it helps.
Greg
eDNA Forum - Deneb Matrix - V4.pbix (1.6 MB)
P.S.:
1) I have no idea how to approach the addition of row totals.
2) I’ll need to do some investigation on how to add alternating row background colour; as this is a formatting issue, and as time constraints necessitate me deferring investigation, I’ll follow-up at a later date if I find something
3) I’ll need to do some investigation on how to add a vertical separator bar between stores; as this is also a formatting issue, and again as time constraints necessitate me deferring investigation, I’ll follow-up at a later date if I find something
4) For more information on formatting values in Vega-Lite, see the D3 format documentation at https://d3js.org/d3-format
Thank you Greg. This is much help. The average price is $ / #. I’m not sure how that would be added either into the total column. I see your PS notes. Understand that this one requires a large time investment and is probably why deneb is not used often as a matrix. Again, thank you.
Yeah, Deneb/Vega-Lite is a visualization tool and not intended for tables or matrices, but can be leveraged with effort. I’d always use the native Power BI table and matrix visuals unless it was not possible.
Greg