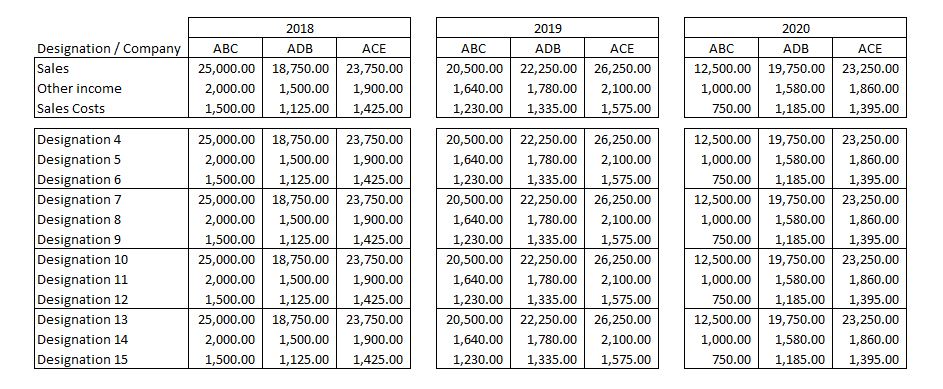
It is suppose to have a filter by year. For example, if i choose 2019, it will show me that year and year -1 and year -2. If i choose 2020 it will show me like the picture is showing.
For this example i would like to make 6 or 7 measures only. I did it with just one year.
My question : how do i make a report like this? Can you give me some ideas?
Thank you all
Best regards
Pedro
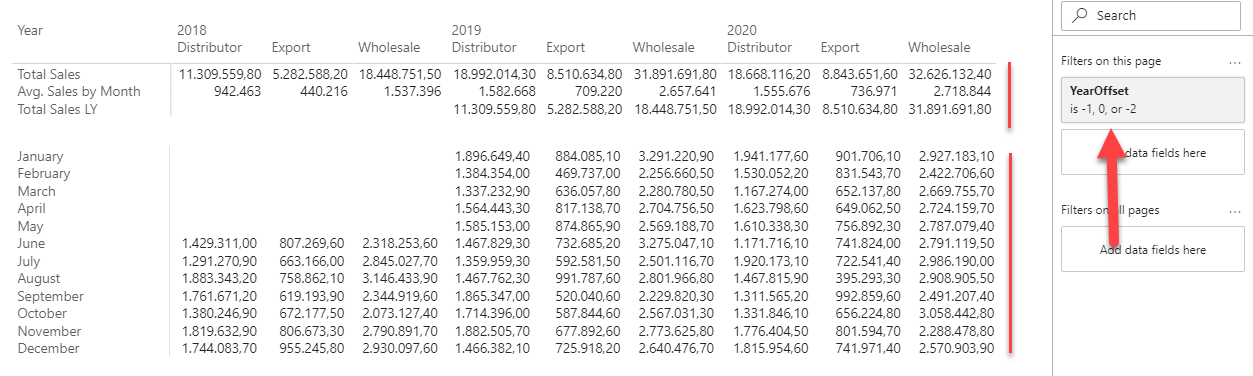
With just the out of the box visuals the only way to come close, is to combine 2 matrix visuals and start tinkering with the settings to find out what works best - optionally combining other shapes…
I have a simple sales model, so look past the displayed dimensions it’s just to give an idea.
Hello @Melissa
Thanks a lot for your help.
Let me tell you what i did, meanwhile i didn’t get any answer to this post:
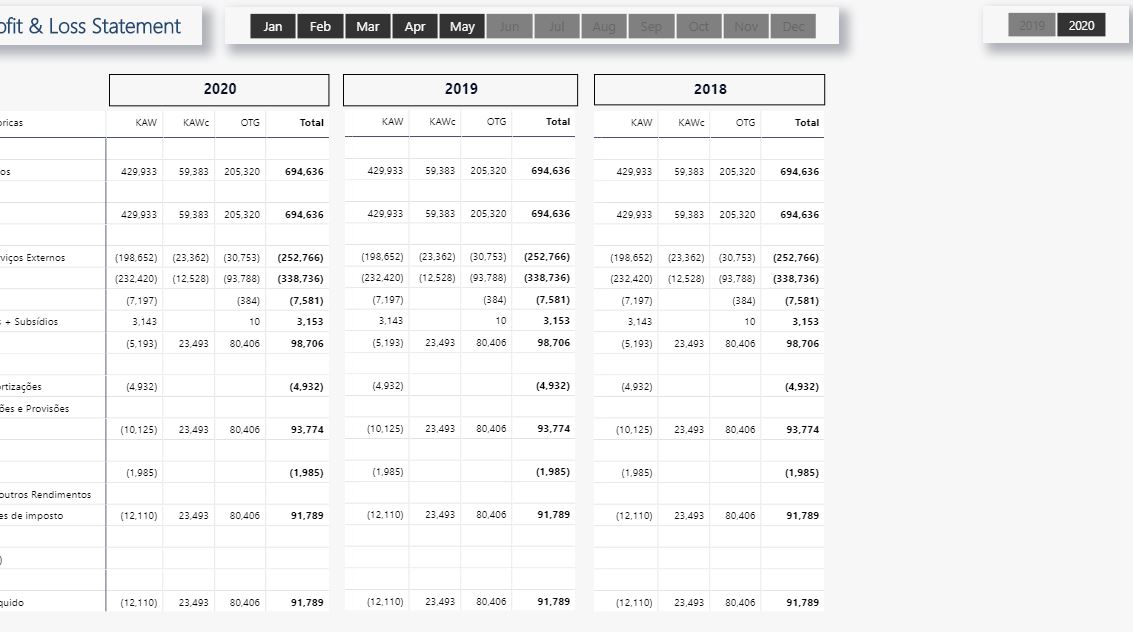
This is the P&L Statement, the way Sam taught us to do.
I did the first matrix on the left and copy it to the right 2 times and hide the row headers. Now i just have to do another with the differences.
With this “solution” i can pick whatever year i need and month.
Also, i’ve add 3 columns on the dates table, year-0, year-1 and year-2. My main measure for each matrix is filtered by …FILTER( ‘Tab Dates’, ‘Tab Dates’[Year] = ‘Tab Dates’[Year - 0] )). The second will be filtering year-1 and so on.
This solution, instead of doing 7 measures for the subtotals it’s gonna be 21, 7 for each matrix visual.
Also, i’ve never heard about joinning two matrix visuals, as well as the yearoffset, don’t know how it works.
What do you think @Melissa? Should i delete this one and start all over?
Thanks a lot
Pedro
P.S. Forgot to say that those year boxes above are those columns i’ve create on the date table