Hi,
I have an issue with matrix visual and I need help.
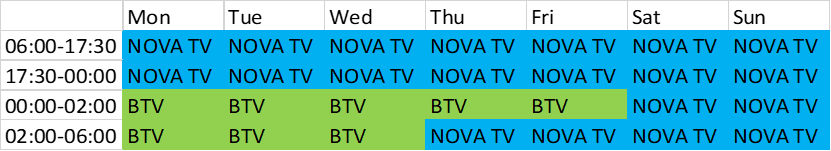
Here is a picture of the Desired state :
Here is what I managed to visualize:
I am using a DAX measure to find the 2nd channel by its value.
I can’t find if the DAX measure should be improved or the matrix organization to be able to achieve the wanted visual state.
Here is the pbi file with sample data:
sample-for-forum.pbix (3.6 MB)
Here are the tables for the pbi file.
PowerBI-data-forum.rar (916.1 KB)
Thanks a lot!
Radost
Hi @radost_ilieva, while waiting for other members to jump in, I suggest using the forum search to discover if your query has been asked before by another member. Thanks!
Hi @radost_ilieva! We noticed that your inquiry was left unsolved for quite some time now.
Looks like your inquiry was out of the experts and users’ bounds.
We strive to answer ALL inquiries in the forum. However, if you are sure that you provided all pertinent context to your concerns and read how to use the forum more effectively and still find your question unanswered, you can check out tutorials to learn this yourself as your membership also comes with relevant resources that may help you with your Power BI education.
While our users and experts do as much as reasonable to help you with your inquiries, not all concerns can be attended to especially if there are some learnings to be done. Thank you!