Dear friends,
I have a situation whereby I need to show or hide some rows in my Matrix visual based on two field in that matrix.
Background is like this example :
- I have table Orders with Gross sales and Net sales transactions, and I have create measures for this for just Sum of this each field. Lets called in TotalGross and TotalNet
- This table is related to my Customer Table based on Customer column in Order table
- So I’ve put Matrix visual contain 3 columns : Customer name, TotalGross and TotalNet
But I want the visual, whenever there is value in either GrossSales or NetSales, show the line but if both are zero, hide it. How am I gonna do that ? in matrix visual ?
I can’t create another measure like Total = TotalGross + TotalNet, and put this on the matrix and set if it is 0 then unchecked it in Filter visual, since there maybe a negate (plus minus) of these two fields that will make the result also 0. I still want to show this, if happened.
Something like this :
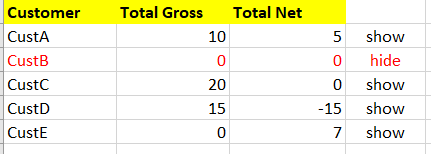
Is there a trick how to do it in the visual setting it self, or I should do something with the table or anything ?
Please help.
Thanks
