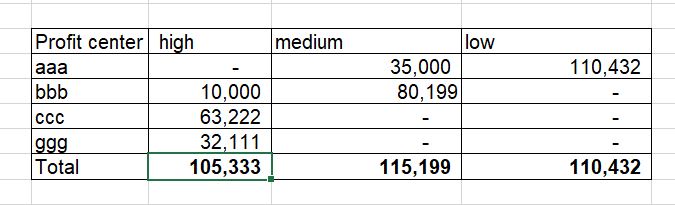
I would like to create a summarized matrix view using one measure as filter for columns. Please see attached the excel file. I have created 3 measures using transaction data that I can not provide here sionce it would require lot of effort to recreate the condensed source data. Since the context for measure calculation was “material” column, I am not able to create a summarized matrix view by getting rid of that column and appyling a filter like “profit center”. Can you please advise if and how it would be possible to achieve the outcome in matrix visualization as shown in the attached image.
Hi @a_nimish - If you are looking to create a Matrix visual as shown in the excel, then the “Risk Class” needs to be a column instead of measure. It is not possible to create this visual using a measure.
Thank you, Ankit. The risk class is derived based on the scalar values produced by two different measures. Therefore, I thought I can not create risk class as a column since it is dependent upon measures and it needs to refresh every month based on new measure calculations upon new data uploads.
Under these circumstances, can I still create Risk class as a column which would be dependent upon two measures?
Hi @a_nimish - Yes, it shall be possible to create a column in same table if your measures are static that is they are not dependent on any filters on page. If they can change based on filters, then it’s better to create a separate table having categories and ranges for both the measures. Then calculate values dynamically. Can refer to below post or similar posts having calculation groups.