I am trying to create a detailed revenue report but struggling to get it right with a matrix table. Attached is the PBI file, hoping someone could help with:
Matrix table - Anyway to sort the table into my format without having to have the row index?
Matrix: Summary column: How do I show the total for each summary column?
Matrix: Level 1 - How to sort so that is goes “Transient”, then "Group; then “Contracted”?
Changing the week end date to Sunday (currently Saturday);
Create a daily bar graph (Monday to Sunday) with selected week, last week and same week last year (linked to data table and changed through selection of matrix line)
Add column in matrix table for Last week, Week before last week, Month to date, Year to date
Sort order is your friend here, you have a column for the index, make it a sort column and you’re good
you can add summary rows at the row level (see Subtotals section of the formater, and turn on “per Row Level”)
again, sort order (in the attached, I had to rebuild your template table because it could not edit it - but see the added Level 1 sort column)
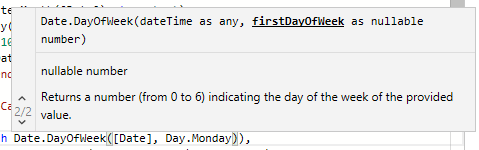
look for the Date.DayOfWeek function in your table function - change that to have Monday as the start of the week:
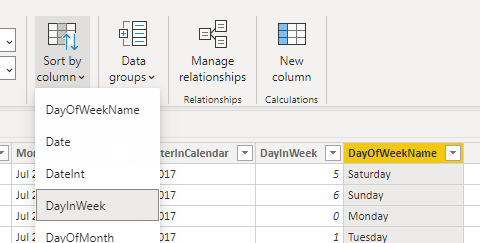
Use Sort columns effectively - if you sort your calendar columns by the numbers (ie, sort DayofWeekName by DayInWeek ), you’ll solve a LOT of headaches
This should get you started - I’ve attached a revised copy of your report (see Solution tab). Revenue Report_DNA.pbix (579.7 KB)
Thanks. Managed to sort out the end week date and sorting. Still struggling with the drill down dax, for example:
ADR: when all is collapsed, it now correctly shows ADR = 125, now what I need is when you expand the ADR to level 1, it needs to show the ADR for each of those descriptions, and same thing for level 2.Revenue Report_DNA_v1.pbix (588.4 KB)
that is because your measure is specifically pointing to the “ADR” measure anytime the summary is ADR,
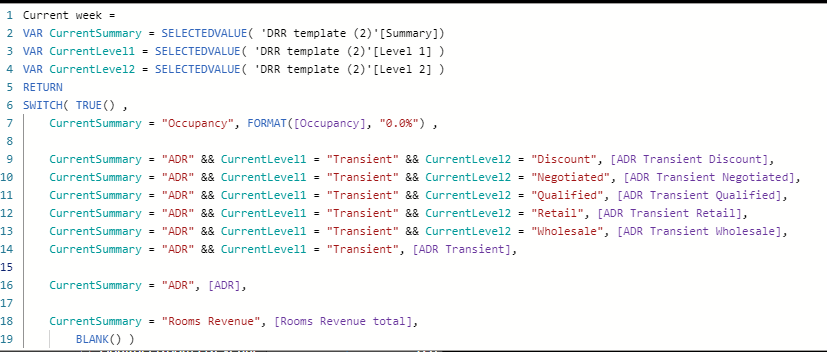
you have the individual measures for each of the levels, you now need to modify your Current Week Measure to call on each of those items.
Probably this would look something like this (note, this JUST fixes the ADR/Transient data,
and notice that I’m adding the grouped totals to the bottom of the switch section (because switch works in order down the list and stops once it returns true)
Definitely take a look at the financial video linked in Melissa’s post above, it will show you some tricks of using this type of template reporting.
Same also has many videos on YouTube on financial reporting - like this one: https://www.youtube.com/watch?v=kPhGxoL59BMRevenue Report_DNA_v1.pbix (588.3 KB)
Perfect, that’s what I was looking for. One last question on this topic: is it possible to add text boxes that are linked to the weekending date table? I.e have a different one pop up with commentary linked to the selected week?
Then yes, you just need to write a measure to return the text you want:
Week Ending Message =
VAR Total = [Rooms Revenue total]
VAR PriorTotal = CALCULATE( [Rooms Revenue total], DATEADD( ‘DRR date template’[Date], -7, DAY ))
VAR Difference = Total - PriorTotal
VAR NegDiff = Difference * -1
RETURN
SWITCH( TRUE(),
Difference > 100, “Room Revenue is up " & FORMAT( Difference, “#,##0” ) & " versus Prior Week”,
Difference < 100, “Room Revenue is down " & FORMAT( NegDiff, “#,##0” ) & " versus Prior Week”,
“Room Revenue is effectively flat versus Prior Week”)
Hi @Stuart. AFAIK there is no way to dynamically set a text box. If you use @Heather’s approach, you can include dynamic text using measures using the same font attributes. If you use the Enlighten Data Story custom visual, you can use static text with placeholders for dynamic measures and the different font attributes for the text and the measures. Hope this helps. Greg
I suppose the other possibility would be to set up a measure for your comments, and then assign that to a custom tooltip - the comments would be available on hover over the week’s data