Hi!
I have a question which I cant find the answer to in all the videos on the site. I would be most grateful if someone has a solution for this one, or can point me towards a resource that will help me figure it out for myself:
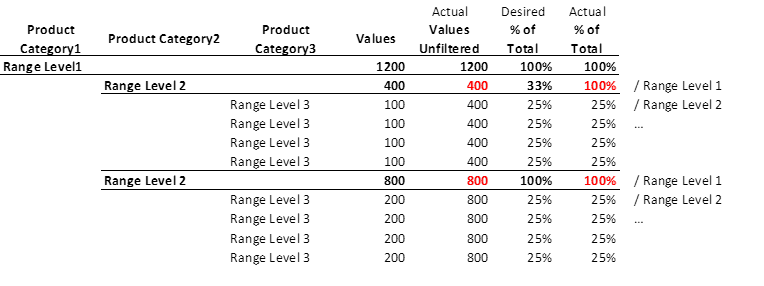
Picture of Desired Result vs current outcome attached:
The Measures I have created are as follows
Values = SUM (Fact Table[Sales])
a simple sum of the column to fetch the total sales data for everything
Values Unfiltered = Calculate ( [VALUES], ALL (ProductTable[Range Level 2]) )
in order to remove any filters in my table that filter the products
% of Total = DIVIDE ([Values], [Values Unfiltered])
in order to calculate for each row, the relevant % of the total
As expected this means that the SUBTOTALS for Range 2 are incorrect and hence so are the %'s - the desired result is that a single measure is created which lifts the filter applied for each row/category.
Is there a solution to this where there are > 2 levels in my matrix visual? Perhaps its 2 steps that lift each filter and then chooses one to use depending on the context in the table?
Many thanks!
James
