Hi All,
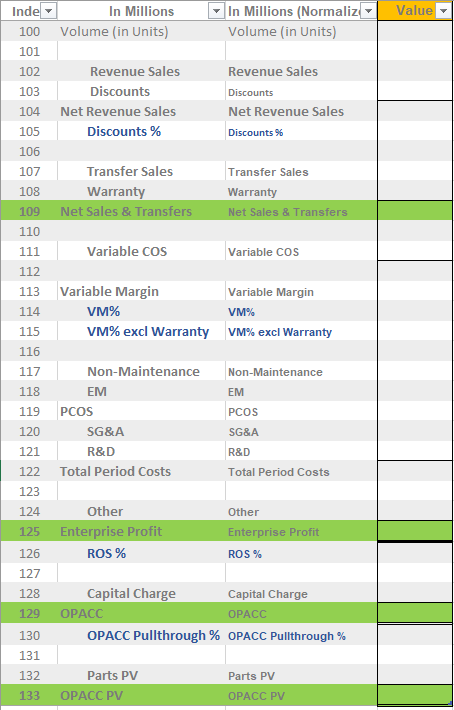
I have this profit & loss template that I created for PowerBI. I colored in green the rows that I want to stand out in PowerBI. I would like to have the data in those rows Bold and with a different background color when I generate a Matrix visual. I am struggling to achieve that formatting. Can someone help me out?
Thanks.
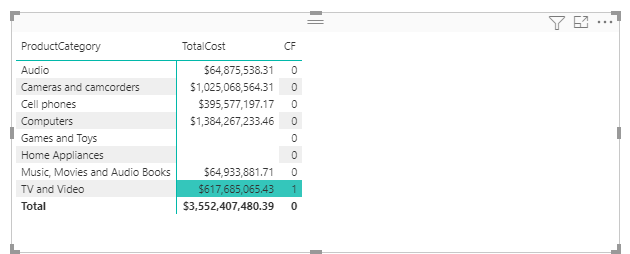
@rnguno10 You can conditionally highlight the values with the measure
CF =
IF (
    SELECTEDVALUE ( ProductCategory[ProductCategory] ) IN { "TV and Video" },
    	1,
    		0
	)
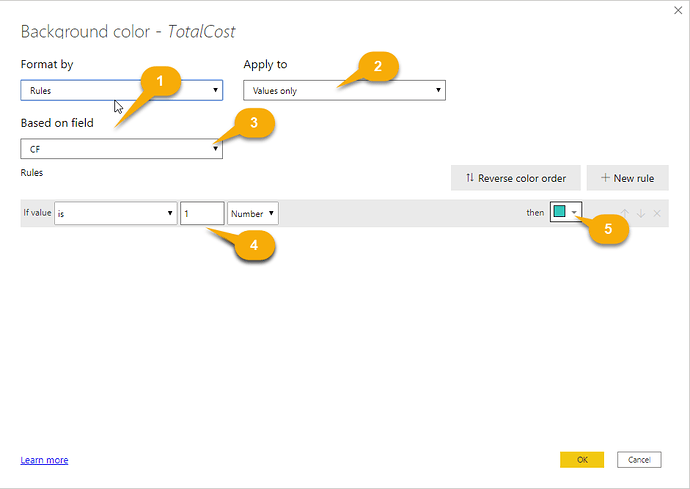
Then go to conditional formatting tab, select background color then advanced controls and then perform the following steps:
However, note that the conditional formatting doesn’t work based on rows but on columns therefore, you can not format the Row Field.

Thanks.
Thanks a lot, MudassirAli! That was very helpful!
1 Like

