I want to create a matrix. In the rows, I want the dates for the last 7 days. In the values section I want the sum of transactions.
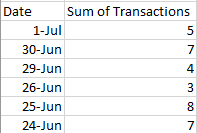
I’m looking for something like this…
(** notice since there are no transactions on the weekend, June 27 and June 28 are not on a row**)
When I first tried this, I put a filter on the visual using the Day Offset in my calendar table. Basically Calendar[Day Offset]>=-7.
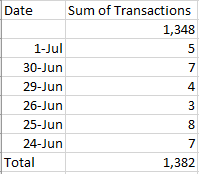
The problem is that a blank date shows up on the top of the matrix, with a sum of all the transactions beyond the 7 days. It looks like this…
(**Also the total is for all transaction dates not just the last 7 days)
Melissa,
Thank you for posting this. It is really exciting. This opens up a huge range of possibilities. It will take me some time to figure it out, but knowing it is possible and having the roadmap is a huge help.
Regards,
Bill
 . Great- glad to hear that worked well for you.