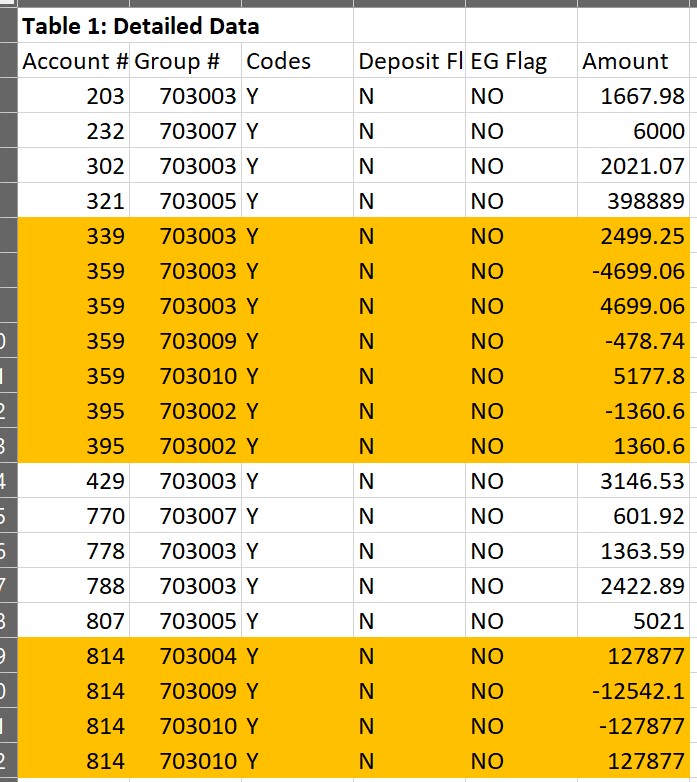
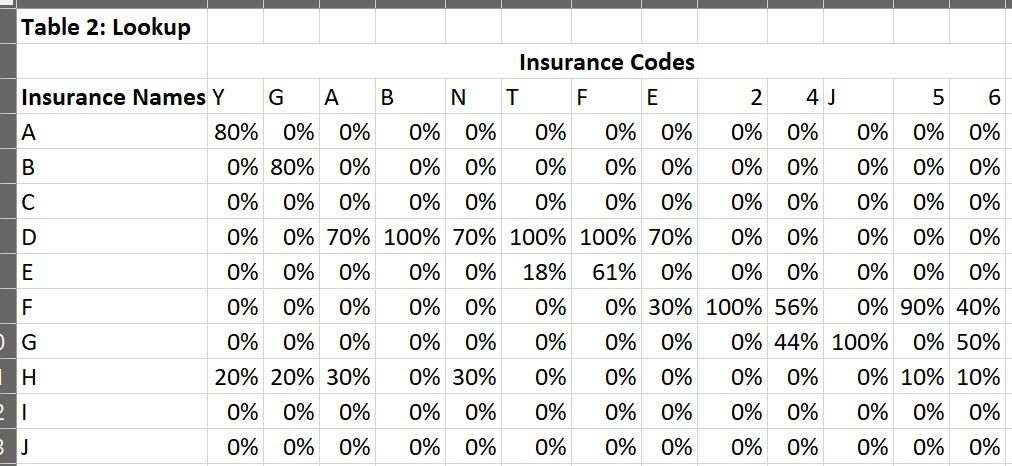
I have two tables one is a detailed accounting (fact table) with account no, group #, insurance codes, two flags columns and amount. The second Table (In a matrix format) is a lookup and includes insurance names (A thru J), insurance codes(Y thru 6) and %. The only common filed between the two tables is insurance codes that are duplicated in both Tables. I need to join the two tables to calculate various measures. In Excel this is done rather manually with sumproduct formula. I have tried left join in SQL and then connect final table to Power BI. I also tried joining the two tables in Power BI with many to many relationships with no avail. Enclosed are images of the two Tables. As you can see even account no in Table 1 are not unique (highlighted in Orange) considering other columns except Amount. I was thinking of creating an intermediary Table but there I can’t create a unique composite key.
Finally, I incorporated the lookup Table into the detail one manually and things are working. However, this technique defeats the purpose of streamlining and automating the report if every month when I get GL data I have to manually bring the lookup Table as well. Any ideas/suggestions of how to design the model?
Nick,
Thank you for willing to help out. I prepared a file (enclosed zipped)
The file includes four tabs:
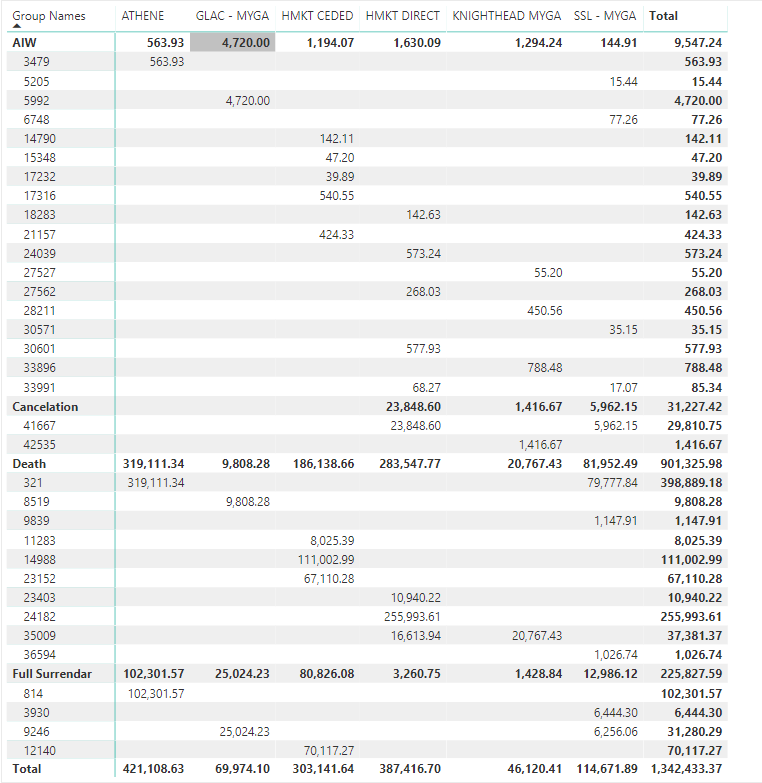
GL data: This is like fact table and contains detailed data
Insurance%_lkup: This is the lookup table with insurance names, codes, and percentages.
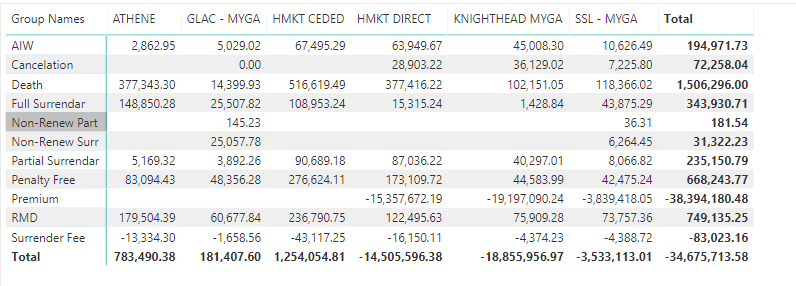
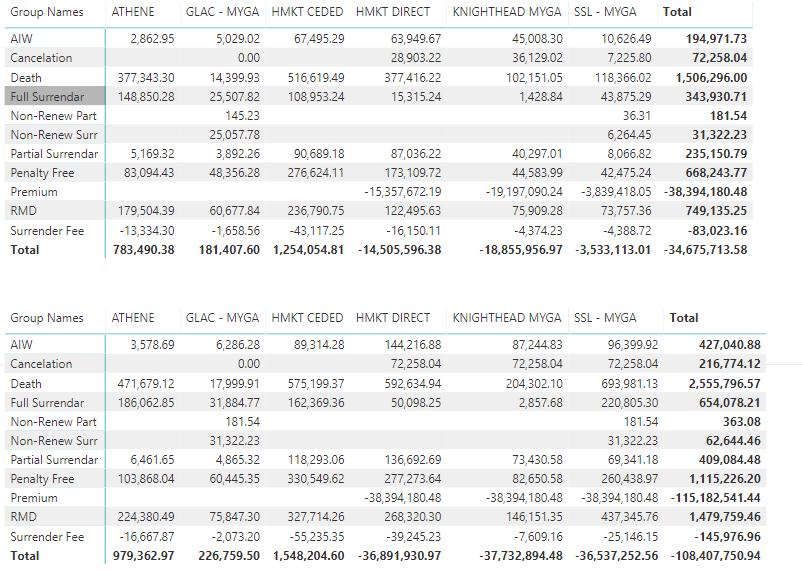
DesiredOutcomes: That’s the final Table
Excel Version: This is how it’s done in Excel version. Look at Final table where there is sumproduct formula. Most of the data come hard coded
Ideally, I like to model (make one to many relationships) these in Tables, SQL, or Power BI so I can easily update month to month. Hope this make sense. I got it in Power BI by making Many to Many relationships and incorporated lookup table in to detailed data far from data modeling and streamlining the report. Anything else, let me know please. TestFile.zip (3.8 MB)
@Helal-
Thanks for adding that file, really helpful. This is a good challenge! I will work on in it in the next few days and hopefully get something that can help you out
So got really close here, there are some small discrepancies from your desired output table and what I got, but the vast majority match. Maybe you could take a look since you are more familiar with this data?
Here is the PBIX file: M2M example.pbix (54.8 KB)
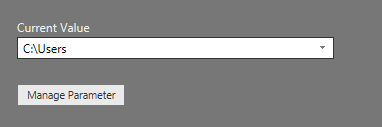
Everything was done in Power Query. I made a parameter where you enter in the location of the excel file:
and with that being said, in the test file:
Create GLData in the Lookup table into Tables (click in the data and hit Ctrl+t)
Nick,
Awesome and thank you so much. However, I am having hard time following the steps in creating new Testfile. Should I combine the GLdata tab with Insurance%_lkup and then format it as Table and rename them to GL and Diminsurance? Will you also send me the new Test File?
Great and thank you again. Let me see if I understood the steps. You basically grabbed the data from the Excel file I provided (GLdata and Insurance%_lkup) and formatted them as Table. Then you pulled them into Power BI and with Power Query you merged them into one final data set. If I am correct, then how do I incorporate/update the report with new GL data let’s say from Jan and Feb 2019? Also, how about making changes to Lkup Table (insurance) such as adding/deleting insurances and changing percentages. In sum how do I streamline, update, and maintain the report. I also do need to grab the amount by itself without multiplying it by %. Sorry for all the questions but I am fairly new to Power BI.
That’s more or less what happened there. If you look at all the applied steps it got a little involved there, but that’s what made it fun
Updating, well that’s the beauty of Power Query. All the steps I did will apply to whatever data is entered into those two tables in excel. Though they can come from wherever, changing were the source data comes from is not that hard.
Getting the amount by itself is definitely doable, as it exists somewhere just have to find it. I will try to get to that this weekend.
Also, one thing when you enter the file path in Power Query, be sure add in the \TestFile.xlsx
And dont apologize for asking questions, that is how we all learn. You most certainly picked a some-what complex case to get started in! But the more you use the more it will make sense
Ah that’s fantastic. I very much appreciate your help and guided me thru the learning process. Just pick your brain and expertise, I was told that the best in data processing and visualization is best to do data modeling in SQL and get then connect the front end app such as Power BI, Tableau, etc…to the final and clean table in SQL. Any comments?
Hi Nick,
One more question. I noticed that the GL table you created is an aggregate and account# is removed. The reports I am working on includes aggregate and detailed data. Another words, how do I retain account# from GLDATA?
Another cool thing about Power Query is that if you get your data from a relational database (such as SQL) some of the transformations you do in PQ will actually be translated into SQL and those transformations will actually be done in SQL Server before coming to PQ, this is what we call Query Folding. Now, query folding is not available for all transformations and once the query folding is broken it is broken. So best to wait as long before you use a transformation that will break that query folding. That’s a whole different topic though. Basically do as much as you can at the source, but leverage query folding to make that as efficient as possible.
Nick,
Thank you again and I would certainly follow the steps in the PQ. Just opened the latest M2M Power BI file and noticed that the Account #s are incorporated but lost Insurance Codes. Am I correct? I will look more closely though.