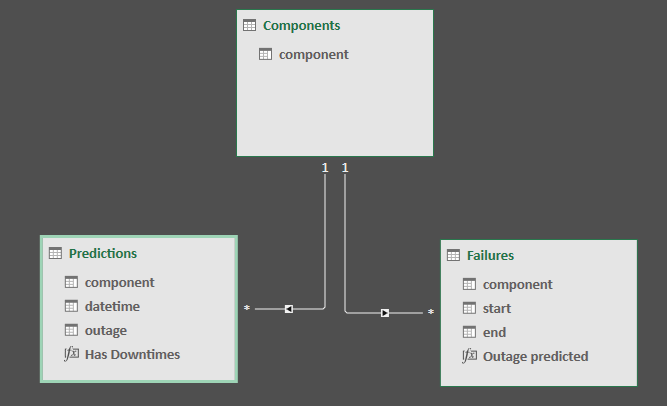
I’m working on a small model to find matching items in two different tables related from a many to many.
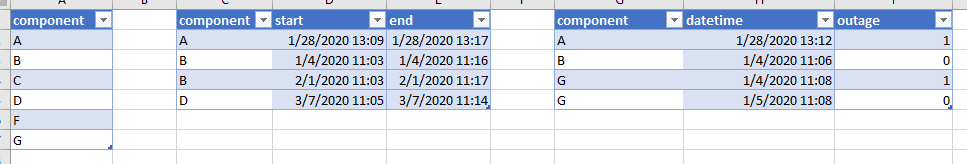
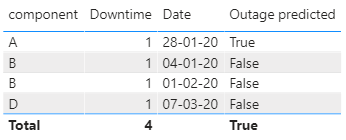
One table has failures, that is outages for specific components. The other table has outage predictions computed by a ML module. I’m trying to verify how the ML is performing checking how many outages have been predicted and how many predictions are correct.
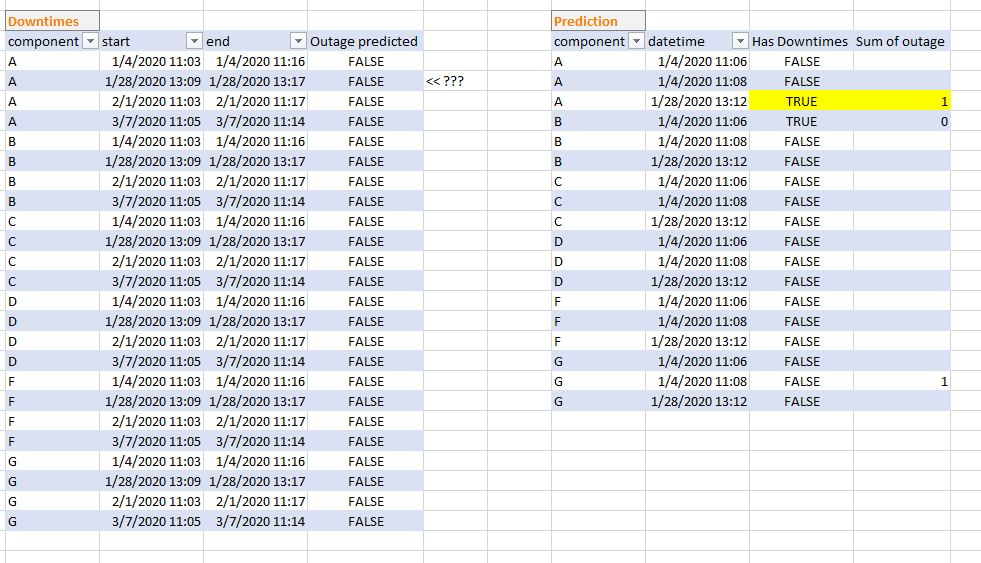
The production model is in Power BI but for brevity I made a small model in Excel with 2 DAX formulas that are essentially the same in PBI, as well the model. The main concern is speed. I didn’t find any better solution than this one, but tables are over 1M rows and PBI formulas even if are working fine takes a very long time. Moreover when I use them, they provide rows even when there is no prediction or outage.
How is that?
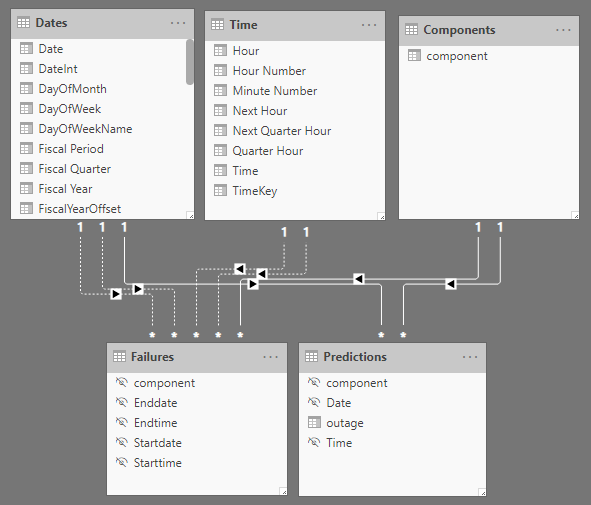
There is no date/time table in your model which means that Power BI will generate auto date/time tables hidden from view. You can check that with a tool like Dax Studio for example, because this can negatively impact model size.
The granularity of a combined date/time value is very high.
Don’t know if this will improve performance, but that’s no reason not to try, right?
Started with the Model by adding a Date- & Time tables and separating all date/time values.
Hi @Melissa,
thanks for prompt answer. Your model does exactly what I was trying to do. I made the same formulas on my PBI and speed is no longer an issue.
I had added date and time tables but in my case they apparently didn’t help.
I didn’t understand the way you use inactive relations to leverage time dimensions
Glad to hear that worked well for you.
Please don’t forget to mark the post that answered your question as Solution via the … (3 dots)
The inactive relationships are required because there can be only one active relationship between two tables BUT both Start- and Enddate are- and should be treated equally in these DAX calculations.
@sam.mckay showcases how to deal with that in what’s know as the orders in progress pattern
.
Furthermore @BrianJ brought some video’s together in this post on TREATAS and USERELATIONSHIP
.
I’m confident that after reviewing these you’ll have a better understanding on how this works.