I am building a dashboard for my brother’s medical practice. The data is coming from a practice management system and contains tables such as:
Appointments
Charges
Payments
Patient profiles
etc.
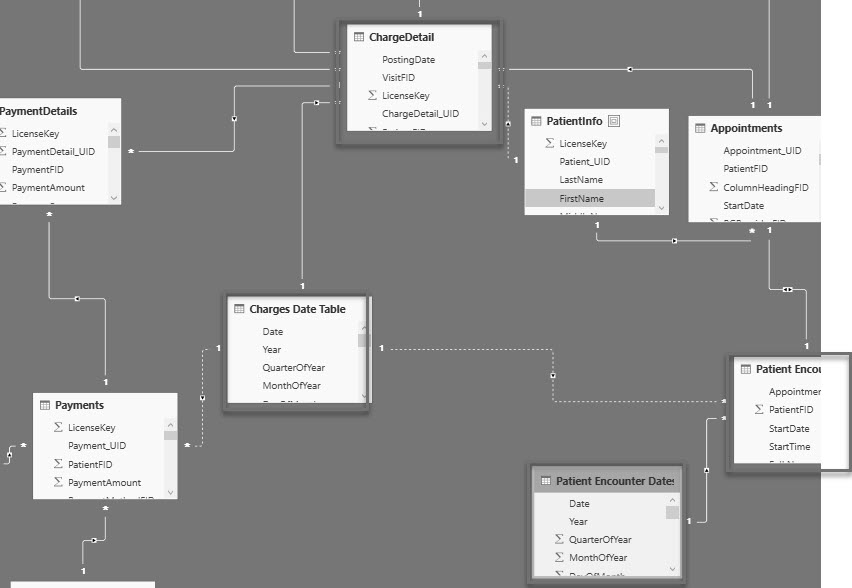
I created a date table for use in patient appointment report pages and linked it to appointments table. I then realized I needed a date table for filtering charges so created a separate Charges Date Table.
Now here’s an example of the problem I am running in to:
I have a measure called # patient encounters = COUNT(Patient_Encounters[Encounter_UID]). It gets filtered down in a report page that looks at patient volume metrics based on the Appointments Table.
Now I am creating a separate report page for charges, which has its own date table. Naturally, if I add the measure # patient encounters to that page I get the total patient encounters because the Charges Date Table is not filtering the measure.
I don’t want to affect the use of the patient encounter measure in other pages by making it actively related to the charges date table. What would you suggest I do?
Create a duplicate patient volume measure which uses the relationship between charges date table and appointments?
Replace the # patient encounter measure with something smarter, and what would that be?
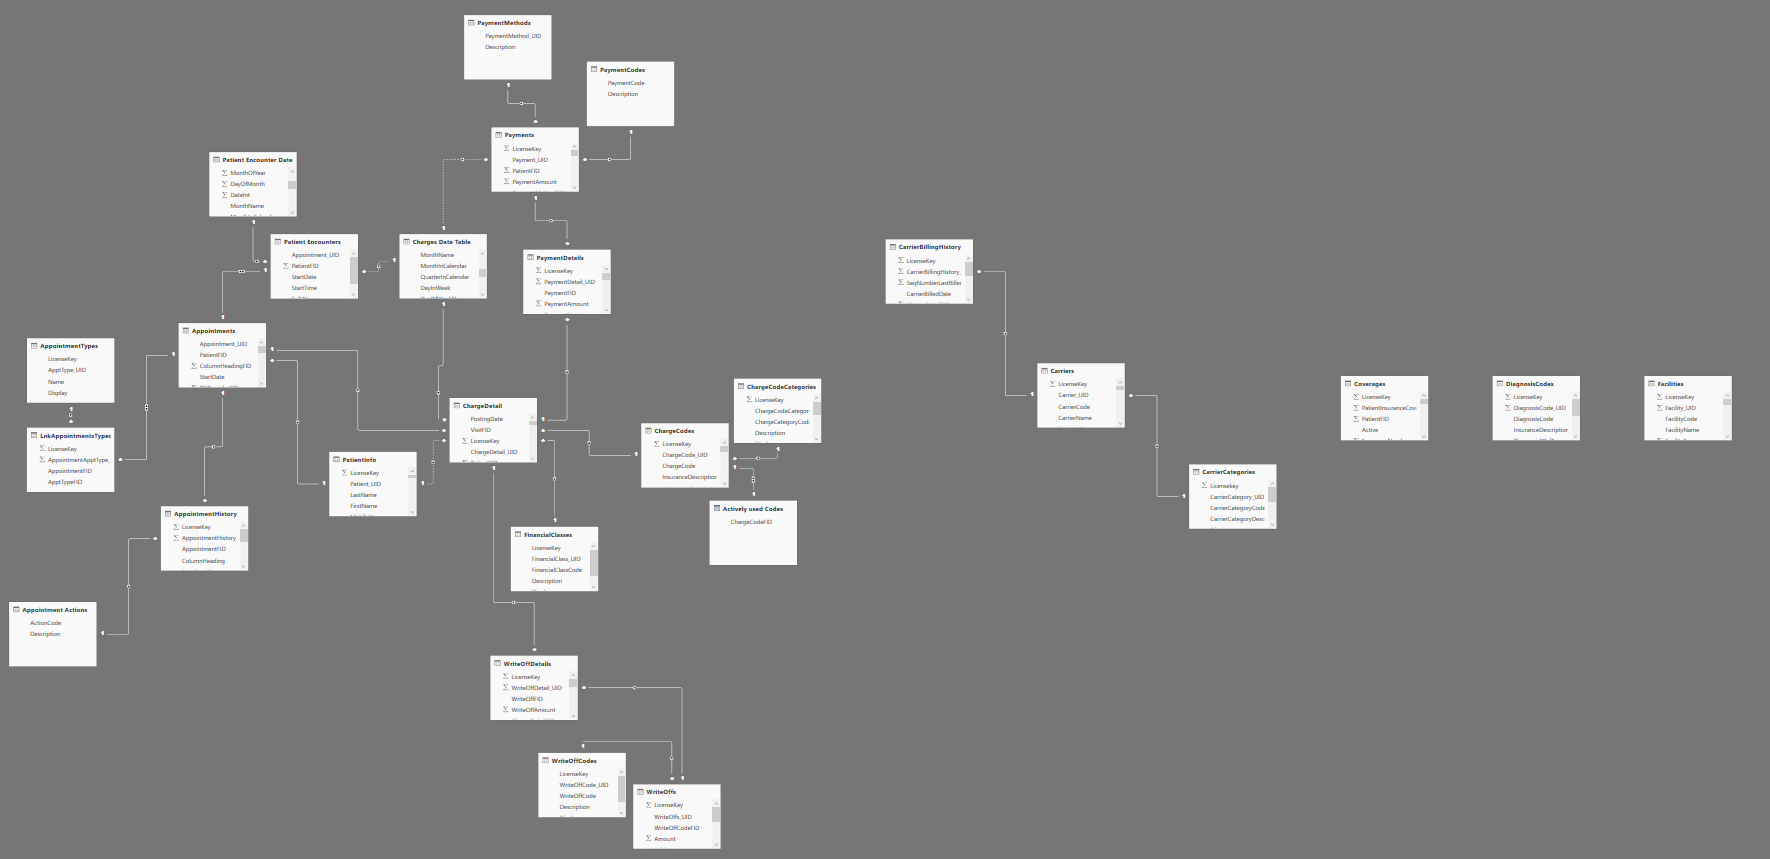
Firstly you model needs to be simplified. Certainly review this course when you can. It’s incredibly important to set up the data model as intuitively as possible.
You should only have one date table first of all. So that needs to be changed before you do anything else.
Just looking at this closely, there’s not much point in moving forward until the model is optimized as the answer will be so simple once this is fixed up.
You want to make sure you lookup table are on the top row and your fact table on the bottom row, and have a waterfall of filter flowing down the hill.
You filters should all be really intuitive and you need to be able to visualize this simply.
Can you go through the course? Everything you need is in there and will save you 100s of hours on the development side if you can clean this up.
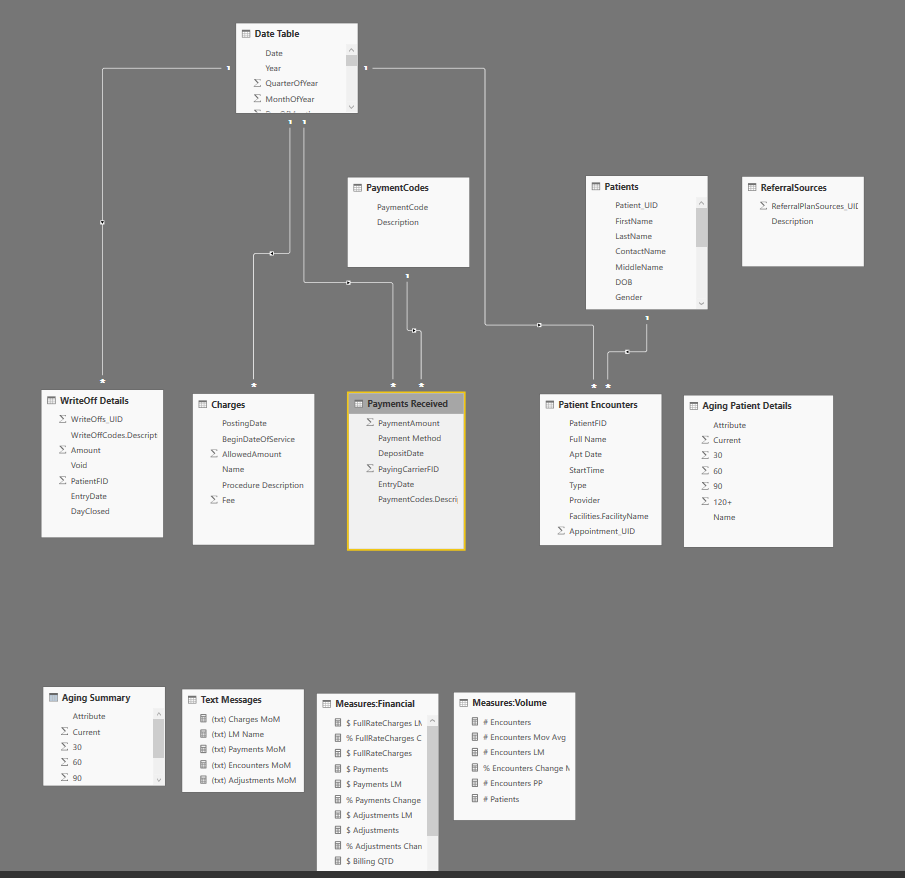
Thanks to Sam’s suggested viewing materials (Advanced Data Transformations & Modeling) I completely re-built my data model. Experienced relational database designers are at a disadvantage here because it is counter-intuitive to flatten and simplify the database design which works for you when you are creating an application.
as Sam pointed out to me - creating queries becomes much simpler and straightforward once I did away with multiple directional relationships: everything flows in waterfall style as he advises and so I just needed one single date table to run the entire model.