Hi All,
I am trying to build a tabe visualization in Power BI. Due to the sensitive nature of the data, I am providing dummy data. The data model is as follows:
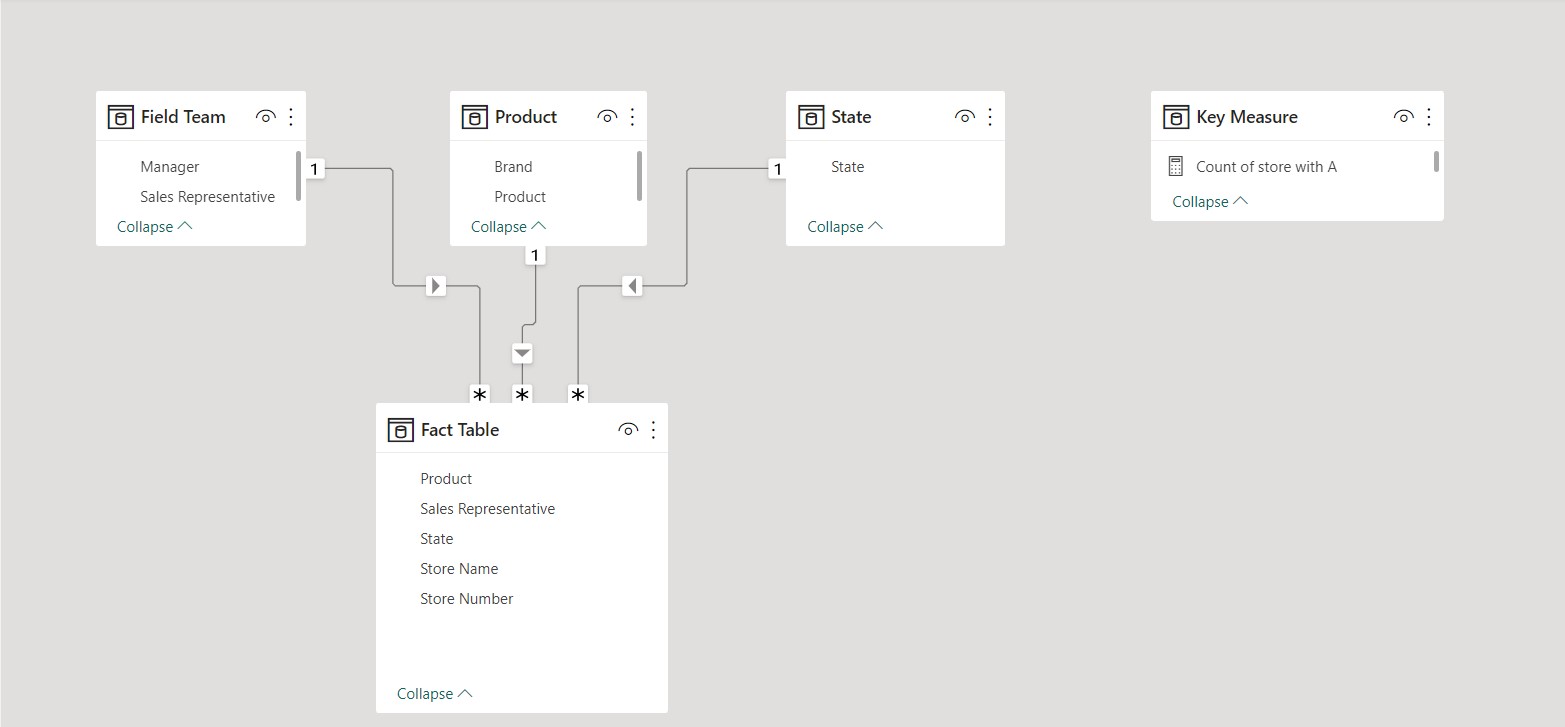
I want to make a table visualization. The column name, number of column should change as per the brand slicer.
I have a table which consist of column, store number, store name, manager, sales rep, brand and product. I want to count the number of store for each sales rep that has atleast 1 prodcut of the brand for and distribution.
The front end and format of the table visualization is
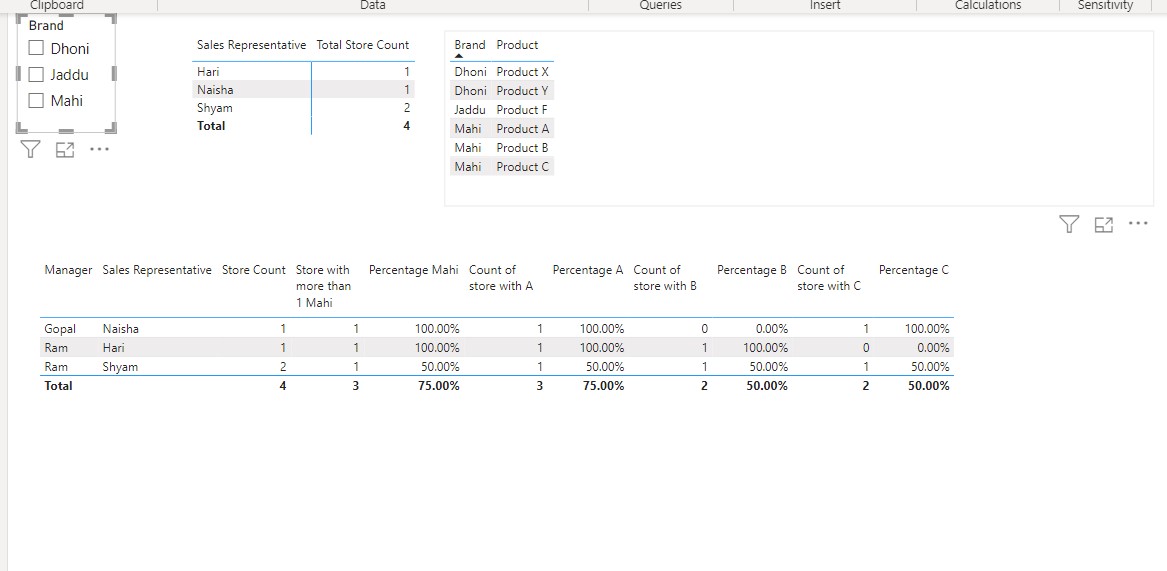
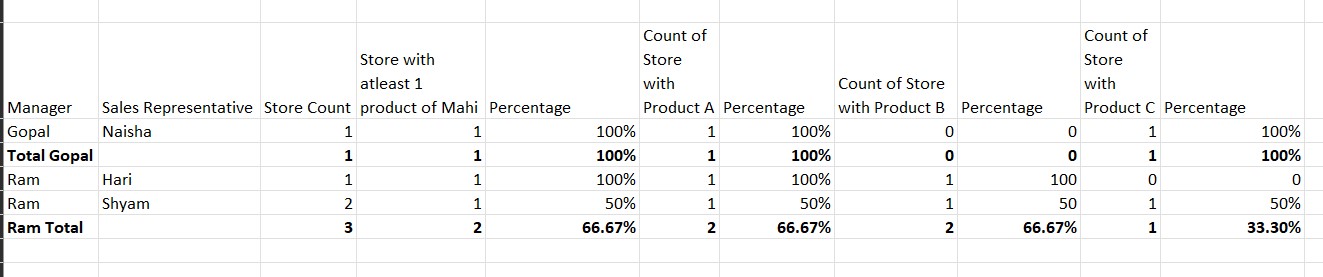
When the user select Brand Mahi, the table visualization should loook like this
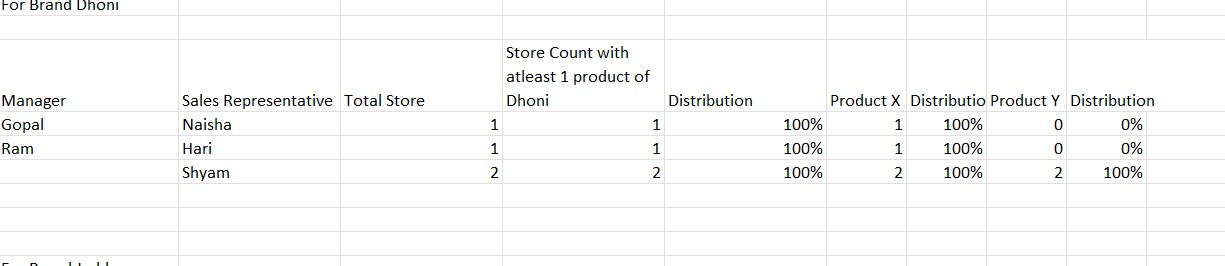
Similarly, when the user select the brand Dhoni, the table should like this
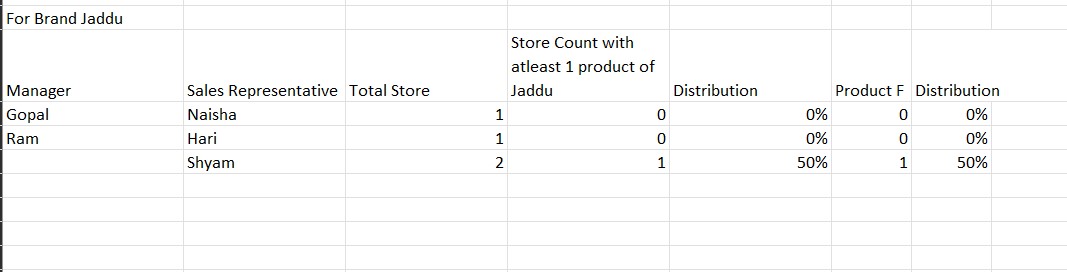
Similary, when the user select Jaddu brand in the slicer, the output table should look like this
It can be created by creating indivisual measure for each Product and when there is huge brand (25) and product (50) it is diffucult to create individual measure for each brand and product.
Request for suggestion.
The pbix file is as
@SamMcKay
@EnterpriseDNA
Could you please help.
Thank you