Hi everyone,
In the past I’ve been busy with the Customer Churn but it seems to be that I’ve forgotten some essential parts…  Can someone help me with a formula?
TestData:
| CustomerID |
Start |
End |
| 1 |
1-1-2015 |
1-1-2020 |
| 2 |
1-7-2015 |
1-10-2016 |
| 3 |
1-12-2015 |
1-2-2018 |
| 4 |
1-2-2016 |
5-10-2016 |
| 5 |
1-8-2016 |
1-2-2019 |
| 6 |
1-5-2017 |
1-1-2020 |
| 7 |
1-11-2017 |
1-8-2018 |
| 8 |
1-4-2018 |
1-10-2019 |
| 9 |
25-7-2018 |
25-12-2018 |
| 10 |
22-11-2018 |
1-1-2019 |
| 11 |
5-1-2019 |
31-3-2019 |
| 12 |
5-2-2019 |
1-1-2020 |
| 13 |
5-4-2019 |
5-6-2019 |
| 14 |
5-5-2019 |
1-1-2020 |
| 15 |
5-6-2019 |
1-1-2020 |
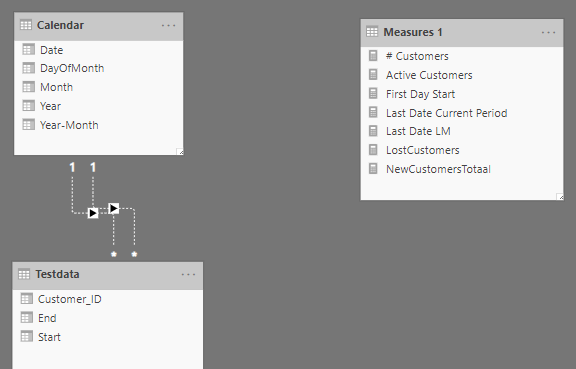
Measures:
# Customers = DISTINCTCOUNT(Testdata[Customer_ID])


Active Customers = CALCULATE([# Customers];

FILTER(Testdata; Testdata[Start] <= MAX('Calendar'[Date]));

FILTER(Testdata; Testdata[End] >= MIN('Calendar'[Date])))


First Day Start = FIRSTDATE(Testdata[Start])


Last Date LM = EOMONTH(MAX('Calendar'[Date]);-1)


LostCustomers =

CALCULATE([# Customers];

FILTER(Testdata; Testdata[End] <= MAX('Calendar'[Date])))


NewCustomersTotal =

CALCULATE([# Customers];

FILTER(Testdata; Testdata[Start] <= MAX('Calendar'[Date])))
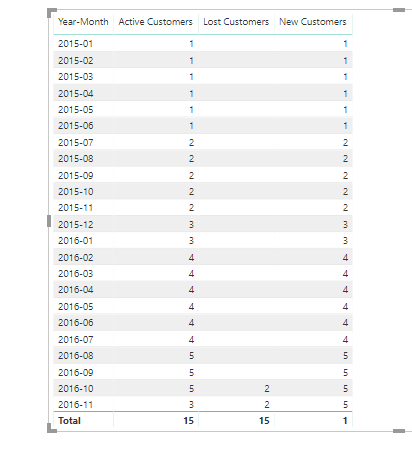
I would like to have the following endresult:
| Year-Month |
New |
Lost |
| 2015-01 |
1 |
|
| 2015-02 |
|
|
| 2015-03 |
|
|
| 2015-04 |
|
|
| 2015-05 |
|
|
| 2015-06 |
|
|
| 2015-07 |
1 |
|
| 2015-08 |
|
|
| 2015-09 |
|
|
| 2015-10 |
|
|
| 2015-11 |
|
|
| 2015-12 |
1 |
|
| 2016-01 |
|
|
| 2016-02 |
1 |
|
| 2016-03 |
|
|
| 2016-04 |
|
|
| 2016-05 |
|
|
| 2016-06 |
|
|
| 2016-07 |
|
|
| 2016-08 |
1 |
|
| 2016-09 |
|
|
| 2016-10 |
|
2 |
I know I have to work with two calculatetables:
-
Current Customers: from First Day Start until Last Date Current Period = MAX(Calendar[Date]
-
Prior Customers: from First Day Start until Last Date Prior Period
and then countrows(except(Current Customers, Prior Customers) but I don’t know exactly how I can write the formula. Can somebody help me?
Thanks in advance,
Cor
One of the solutions:
New2 = CALCULATE(COUNTROWS(Testdata);

FILTER(Testdata; Testdata[Start] >= min('Calendar'[Date]));

FILTER(Testdata; Testdata[Start] <= max('Calendar'[Date])))

Lost2 = CALCULATE(COUNTROWS(Testdata);

FILTER(Testdata; Testdata[End] >= min('Calendar'[Date]));

FILTER(Testdata; Testdata[End] <= max('Calendar'[Date])))*-1
Another solution:
Test New = CALCULATE(DISTINCTCOUNT(Testdata[Customer_ID]); USERELATIONSHIP(Testdata[Start];'Calendar'[Date]))

Lost New = CALCULATE(DISTINCTCOUNT(Testdata[Customer_ID]);USERELATIONSHIP(Testdata[End];'Calendar'[Date]))
I am still curious of the solution with CALCULATETABLE…
Hi Cor,
Your dataset is a bit different here compared to many examples I’ve run on this.
I think you are pretty close actually to getting it by having a look through your formulas.
The calcs are actually not that difficult when you have data set up like this.
You don’t need CALCULATETABLE here because you are dealing with multiple dates in your fact table.
In all the other examples this wasn’t the case. So with the data being completely different, the DAX functions will be also.
I believe these are all you need
Active Customers = CALCULATE([# Customers],
    FILTER(Testdata, Testdata[Start] <= MAX('Calendar'[Date])),
    FILTER(Testdata, Testdata[End] >= MIN('Calendar'[Date])))

New Customers =
CALCULATE([# Customers],
    FILTER( Testdata,
        Testdata[Start] <= MIN('Calendar'[Date]) ) )

Lost Customers =
CALCULATE([# Customers],
    FILTER( Testdata, Testdata[End] <= MAX('Calendar'[Date])))
Remember also when using USERELATIONSHIP to reference the date columns only.
See below
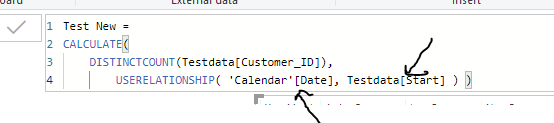
With this function you’re attempting to virtually join these tables up with a relationship so it needs to be like for like columns.
So in summary this was all about dealing with multiple dates in your fact table.
Here’s some recent tutorials I created around this as well.
Thanks
Sam