I’m a relative beginner with DAX, but I’m trying to develop a Dashboard quickly.
I watched your Scenario Method Workshops going through the New Customer and Lost Customer analysis. However, the Lost Customer DAX function wasn’t exactly what I was looking for…
I wrote this DAX function for Lost Customers and it seems to work - well sort of.
The problem is that all the data points are time-shifted by 1 year!
So when I verify the customer data for a lost customer on Jan-2018, I find the customer was lost on Jan-2017.
I don’t really understand the operation of the Filter function on the Date table.
Could you point out some videos that go through the operation?
Thanks,
Rick
LostCustomers =
VAR CurrentCustomers = CALCULATETABLE(VALUES(CustomerInvoices8[Customer]),
                        FILTER(All(Date4),
                            Date4[Date] > MAX (Date4[Date]) -365   &&
                            Date4[Date] < MAX (Date4[Date])))

VAR PriorCustomers = CALCULATETABLE(VALUES(CustomerInvoices8[Customer]),
                        FILTER(All(Date4),
                            Date4[Date] > MIN (Date4[Date]) - 365  &&
                            Date4[Date] < MIN(Date4[Date])-90))

RETURN
COUNTROWS(EXCEPT(PriorCustomers, CurrentCustomers))
How you judge who a lost customer is can vary a little bit, so deciding that logic is the first thing to do.
What the particular formula you reference is doing is…
Looking backwards and comparing the customers who bought in a time window or 12 months to 3 months ago. Then comparing that to customers who purchased in the last 3 months.
If a customer did purchase in the 9 month window but didn’t in the last 3 months, then they are considered lost.
That clarify things?
This is a recent release
Check this out. I cover it in detail during this one.
Thanks for your response.
It looks like I’m on the right track…
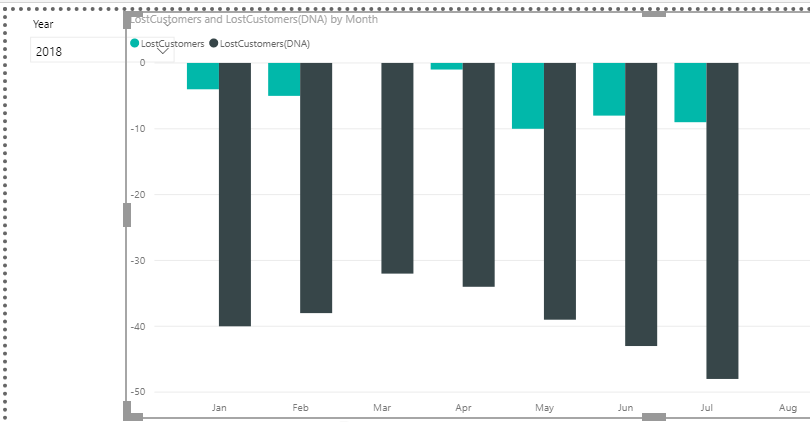
What is really bothering me with this function, is that I’m expecting the data to line-up with the current time context but its actually one year behind…
So, its indicating 4 Lost Customers in Jan 2018, but they were lost in Jan 2017.
Everything is great, except the timeline is off by 1 year!
This is where I’m getting confused and don’t understand what is going on.
Could you elaborate what the function is doing a bit more?
This is the other DAX function I’m using as well.
LostCustomerSales =
VAR CurrentCustomers = CALCULATETABLE(VALUES(CustomerInvoices8[Customer]),
                        FILTER(All(Date4),
                            Date4[Date] > MAX (Date4[Date]) -365   &&
                            Date4[Date] < MAX (Date4[Date])))

VAR PriorCustomers = CALCULATETABLE(VALUES(CustomerInvoices8[Customer]),
                        FILTER(All(Date4),
                            Date4[Date] > MIN (Date4[Date]) - 365  &&
                            Date4[Date] < MIN(Date4[Date])-90))

RETURN
Calculate([TotalSales],
    DATESBETWEEN( Date4[Date], MIN( Date4[Date]) - 365, MIN( Date4[Date] ) - 90 )  ,
    EXCEPT(PriorCustomers, CurrentCustomers))
Can we just double check the formula here your using.
The way it is currently written is sounds like this…
(I’m presuming you’re showing this at a monthly context - Can you add an image of the results you’re seeing also?)
…In the current monthly context you are comparing all customers who have bought in the last year to a customer list who have purchase from 12 to 3 months ago.
There’s to much overlap here of the list and it doesn’t seem right to me.
Can you write out the logic of what you consider a lost customer?
Then also if you can add the file here as well then I can actually see where it’s going wrong.
I watched the video you recommend a few more times and it started to make sense!
I finally understand the Filter / Min/Max function when applied to Date table.
For the first time it really clicked!
My problem was with the CurrentCustomer time period: -365 to -60 days.
There were too many New Customers and Lost Customers during this period that are not accounted for in the PriorCustomer time period: -60 to 0 days.
I settled for the following time periods:
CurrentCustomers: -90 to -60 days
PriorCustomers: -60 to 0 days
Below is my final DAX function that works for my application.
I also illustrate the difference using the 2 time periods.
Its quite large!
LostCustomers =
VAR CurrentCustomers = CALCULATETABLE(VALUES(CustomerInvoices8[Customer]),
                        FILTER(All(Date4),
                            Date4[Date] > MIN (Date4[Date]) - 90   &&
                            Date4[Date] < MIN (Date4[Date]) - 60))

VAR PriorCustomers = CALCULATETABLE(VALUES(CustomerInvoices8[Customer]),
                        FILTER(All(Date4),
                            Date4[Date] > MIN (Date4[Date]) - 60  &&
                            Date4[Date] < MAX(Date4[Date])))

VAR CurrentMonthCustomers = CALCULATETABLE(VALUES(CustomerInvoices8[Customer]),
                        FILTER(All(Date4),
                            Date4[Date] > MIN (Date4[Date])  &&
                            Date4[Date] < MAX(Date4[Date])))

RETURN
IF (COUNTROWS(CurrentMonthCustomers) > 0,
        COUNTROWS(EXCEPT(CurrentCustomers, PriorCustomers)) * -1,
        0)
Looks good though. The logic seems more logical to me.
A really key concept/function to understand on this one is CALCULATETABLE. It’s actually a fascinating function that enable so many advanced insights just like this one.
Hopefully you’re getting the hang of it a bit more.
Hi Sam,
The Churn Analytics solution is great!
I found that the fixed period of 60 days for certain customers did not match up with the apparent churning pattern (Freight Forwarding with irregular yet steady customers).
Hence I have added a “select # days” table to allow the user to run different scenarios.
Hi Sam
Yes, I understand this function and what its doing now.
Which is great because it looks like the time period must be adapted to the customer data your using.
We’re a professional services business and most of our invoices are sent out on the last day of each month and we have a small churn of new & lost clients every month.
So it seems like its best to look back only 1 month beyond the churn-period.
i.e. CurrentCustomers: -90 to -60 days
PriorCustomers: -60 to 0 days
I will test the results some more, but it looks good so far.
Thanks for your help.
Rick
I really love your analytics there are great. However I had a little problem while using the DAX formula on a different data set to get the lost customers. The customer name are in text and when I applied your Dax it gives me a huge number, I tried using distinct count but not working.
Please, how can I get it to give me the distinct count of the customers?
Please don’t ask new questions in closed threads, just create a new topic. That way your question will not be missed, when members are searching for unresolved topics to provide support.
Just link to this topic and supply a sample PBIX, that will be helpful too
Thanks!