Lookup the value from measure output and search the related content in other dimension tables

I have a measure to find the missing lectures by a student in Card Visual. I want to Lookup the value from measure output and search the related content in other dimension tables and display it via other measure.

Missing Lectures = 
VAR classlectures =
    FILTER (
        ALL ( Course[Lecture Index] ),
        NOT Course[Lecture Index] IN VALUES ( Attendance[Lecture Index] )
    )
RETURN
     CONCATENATEX ( classlectures, [Lecture Index], "-")

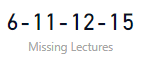
The output visual is missing%20lectures

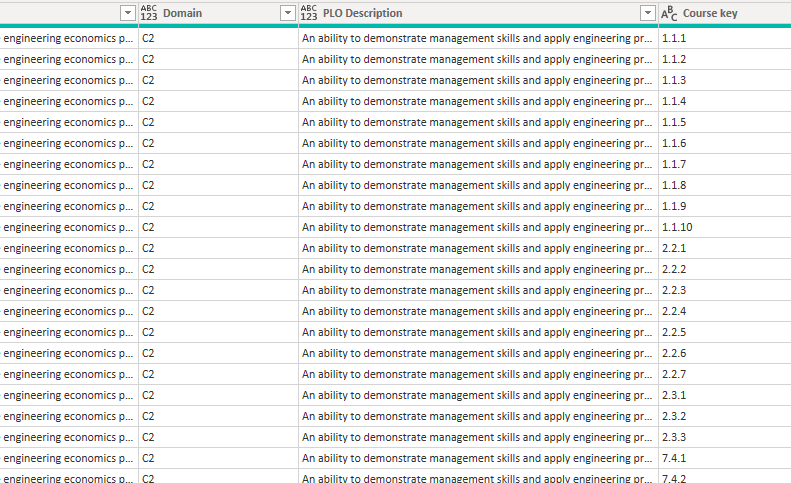
Requirement: I have related lecture contents in lookup table. I want to show the related course contents for these missing lectures seamlessly, preferably, by a measure.
After, it might be possible to find the judgment that why student got less marks due to missing concepts (absence in class lectures).

Hi @Tanzeel,

Can you supply a sample PBIX.
And give one or more concrete examples of what related content from the dimension tables you need returned? Thanks.

@Melissa

Due to various interactions in file, it is hard to make it as “sample file”.
I try to layout the issue.
Display1

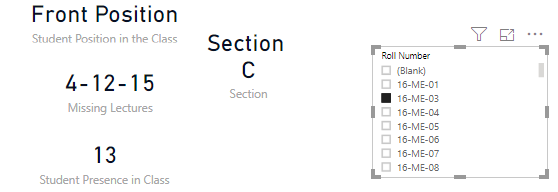
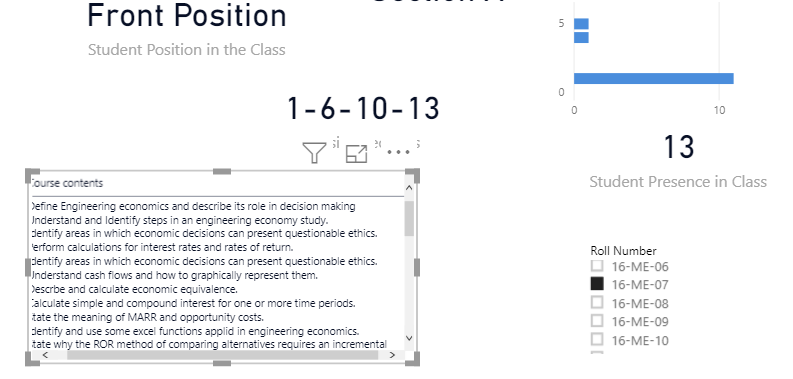
1- When I select the any roll Number from slicer, the measures give us these information.
2- I found the information about student that in which lectures, he remained absent. You may see the information from “Missing Lectures”. In this visual you may see (4-12-15).
3- From it, I want to display the messages that this student could not grab the course contents of Lecture#04, 12, 15.
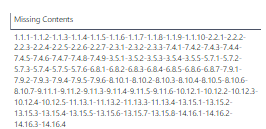
4- You may see the contents as below


5- I wish to display all the missing lectures contents via measure.
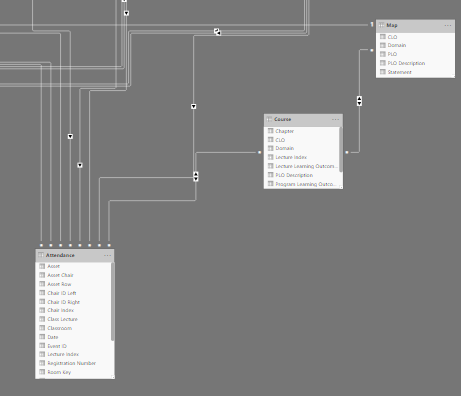
6- Further, Course Table and Attendance table are connected via Many to Many relationship.
Display3
The connection was made through Lecture Index key.
7- This ability can provide me the facility to track down the student weakness due to his/her absence in the class.

The major bottleneck is to retrieve the information from “Missing Lectures” and then map it to lecture contents via another “DAX Measure”. Perhaps, it might give a clarity.

I think you’re pretty close to solving this yourself…

IMO you would need to do some restructuring to this table if you want to return it’s values. Just repeat the data in the first 3 columns for all subsequent rows. It looks like you already have the key in the 1st column.

Once that is done you can use a similar technique as the Missing Lectures measure but instead of concatenating, just return the Missing Lecture ID’s values in the first VAR within your measure.
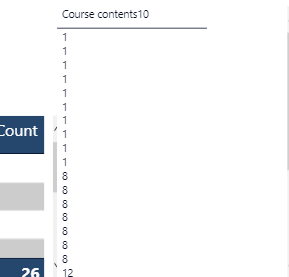
In a second VAR use this to filter the Course Contents table with all matching ID’s and concatenate them.

@Melissa

Lost the way. Tried many combination but not fruitful.

Missing Contents = 
    VAR classlectures =
    FILTER (
        ALL ( Course[Lecture Index] ),
        NOT Course[Lecture Index] IN VALUES ( Attendance[Lecture Index] )
    )
    Return
    VAR coursecontents = 
    FILTER (
        ALL ( Course[Course key] ),
        NOT( Course[Course key] IN classlectures )
    )
    Return
    CONCATENATEX(Course, [Course key], "-") 

I am doing some serious mistake here because it is not looking the VAR returns. For some clues, I am just adding the snapshots.
Display4

Further my course file here.

Introduction engineering economics.xlsx (27.4 KB)

Not to state the obvious but you are comparing Course[Lecture Index] with Course[Course key] that doesn’t seem right. Also does the Lecture Index in this table have a value for each row in your model?

Perhaps you can use the INTERSECT to keep what is present in both tables before the CONCATENATEX

https://forum.enterprisedna.co/t/intersect-except/4958

No success yet.
Is there a way to make the ’List’ of missing lectures instead of ConcatenateX?

It might be helpful to filter the desired result.

Can you see if this is helpful.
eDNA Forum - Lookup the value from measure output.pbix (51.8 KB)

I’ve visualized the Lecture Index in a TEST Table by using SELECTCOLUMNS.
You could do something like:

Missing Contents List = 
SELECTCOLUMNS(
    FILTER (
        ALL ( Course[Lecture Index] ),
        NOT Course[Lecture Index] IN VALUES ( Attendance[Lecture Index] )
    ), "Index", [Lecture Index]
)

Combined above with the data from the excel sheet, it will be something like:

Course contents = 

VAR MissingLectures = 
    SELECTCOLUMNS(
        FILTER (
            ALL ( Course[Lecture Index] ),
            NOT Course[Lecture Index] IN VALUES ( Attendance[Lecture Index] )
        ), "Index", [Lecture Index]
    )

VAR CourseContent = 
    CONCATENATEX(
        FILTER( tCourses,
            tCourses[Lecture Index] IN MissingLectures
        ), [Lecture Learning Outcomes],  
        ", " & UNICHAR( 10 )
    )
RETURN CourseContent
1 Like

@Melissa

Thanks. It’s really amazing.
My secret blunder was that I didn’t remove the relationship between Attendance and Course. I think with ‘IN’, I have to care about it. Now, There is no relationship between these two tables.

I will try to do some formatting.
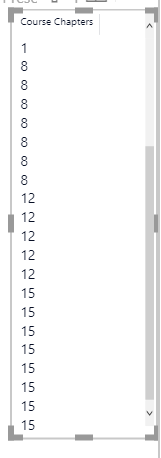
Further, If I want to display Chapter No then should I introduce the new VAR for Distinct Values, in virtual table, or there is any other appropriate way.
Display2

Hi Tanzeel,

Great to hear you’re back on track!

You could or just wrap DISTINCT around it, whatever makes more sense to you.

VAR MissingLectures = 
DISTINCT(
    SELECTCOLUMNS(
        FILTER (
            ALL ( Course[Lecture Index] ),
            NOT Course[Lecture Index] IN VALUES ( Attendance[Lecture Index] )
        ), "Index", [Lecture Index]
    )
)

Is exactly the same as:

VAR MissingLectures = 
    SELECTCOLUMNS(
        FILTER (
            ALL ( Course[Lecture Index] ),
            NOT Course[Lecture Index] IN VALUES ( Attendance[Lecture Index] )
        ), "Index", [Lecture Index]
    )  

VAR DistinctMissingLectures  = DISTINCT( MissingLectures )
RETURN

    DistinctMissingLectures

@Melissa
I was thinking the same and also tried in many combinations. But some hidden aspect hinders it.

Course contents = 

VAR MissingLectures = 
DISTINCT(
    SELECTCOLUMNS(
        FILTER (
            ALL ( Course[Lecture Index] ),
            NOT Course[Lecture Index] IN VALUES ( Attendance[Lecture Index] )
        ), "Index", [Lecture Index]
    )
)
VAR DistinctMissingLectures = DISTINCT( MissingLectures )
VAR CourseContent = 
    CONCATENATEX(
                FILTER( Course,
            Course[Lecture Index] IN DISTINCT( DistinctMissingLectures)
        ), [Course Chapters],  
        " " & UNICHAR( 10 )
    )
RETURN CourseContent 

Even, in this code, you may see that I tried all the combinations of DISTINCT function.
I got the same output each time.
Display3

@Tanzeel,

Apologies I completely misunderstood you previously. Try something like this:

Course chapters = 
VAR MissingLectures = 
SELECTCOLUMNS(
    FILTER (
        ALL ( Course[Lecture Index] ),
        NOT Course[Lecture Index] IN VALUES ( Attendance[Lecture Index] )
    ), "Index", [Lecture Index]
)
VAR CourseContent = 
    CONCATENATEX(
        SUMMARIZE(
           FILTER( Course,
           Course[Lecture Index] IN MissingLectures ),
           [Course Chapters] ),  
        [Course Chapters],
        ", " & UNICHAR( 10 )
    )
RETURN CourseContent

.
image

Here’s my sample file: eDNA Forum - Lookup the value from measure output.pbix (51.9 KB)

2 Likes

It’s really tricky. Many many thanks for prompt support.

Kindest Regards,