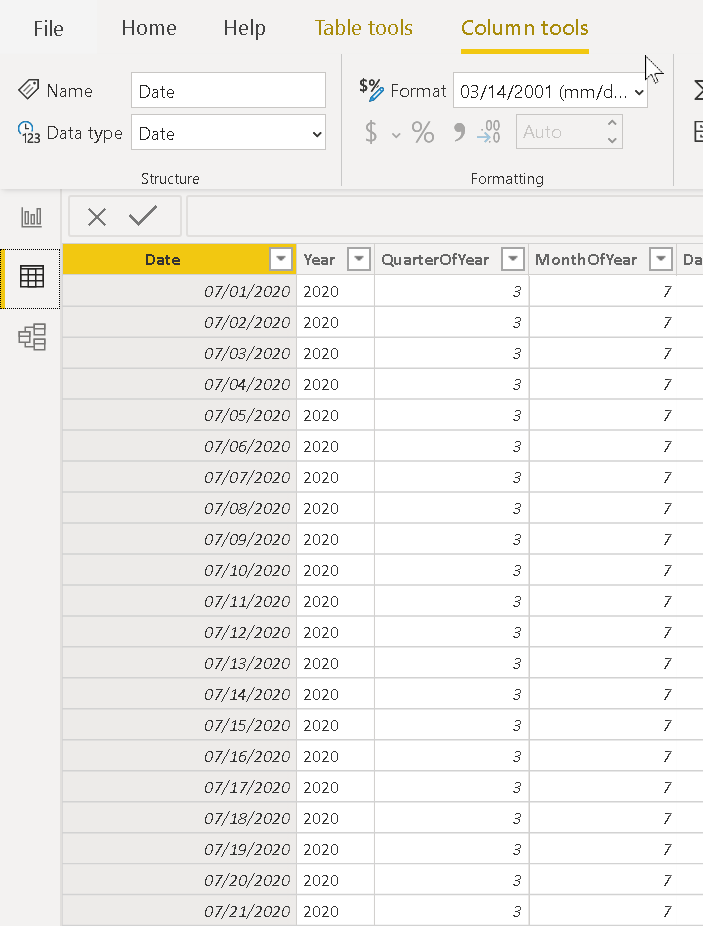
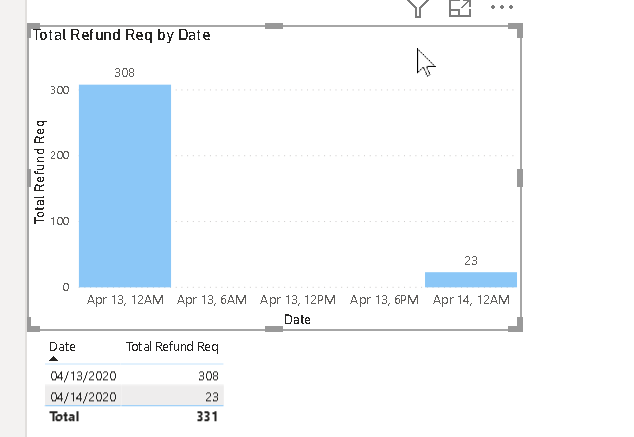
I have a “Date” table that has “Date” join to a Refund table with date. Both are defined as date but when I dragged date to a line graph it’s adding the time. Both fields are defined at mm/dd/yyyy.
I dont want time on the line graph! Help.
I have a “Date” table that has “Date” join to a Refund table with date. Both are defined as date but when I dragged date to a line graph it’s adding the time. Both fields are defined at mm/dd/yyyy.
I dont want time on the line graph! Help.
I think the problem here is that your data type is still date/time, even though your format is mm/dd/yyyy. Go into Power Query and make sure your data type is set to Date and not Date/Time.
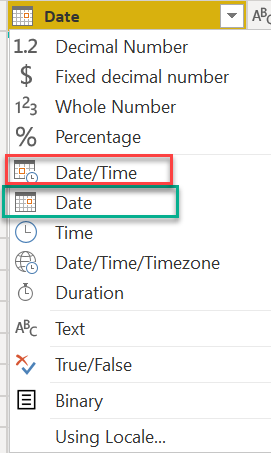
See if this fixes your problem, and if not give a shout.
Hope this is helpful.
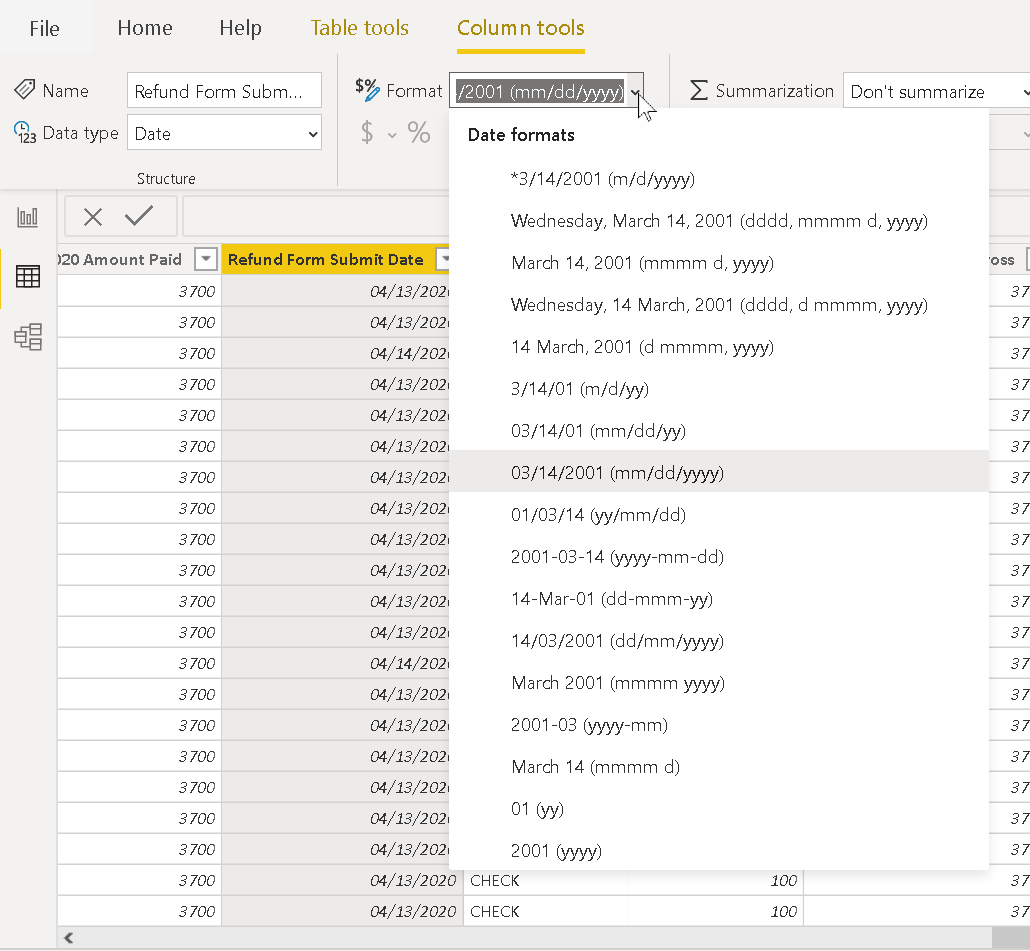
@mbraun, are both the dates formatted as date in the transform data query editor too?.
I believe everything is set to date in the Query Editor too.
Hmmm… Would you mind sending a screenshot of what you’re seeing in Transform/Power Query?
(basically the same screenshot from my message above). That may help diagnose the issue. If not, may need a copy of your PBIX to straighten this out.
Thanks.
Thanks for posting your question @mbraun. To receive a resolution in a timely manner please make sure that you provide all the necessary details on this thread.
Here is a potential list of additional information to include in this thread; demo pbix file, images of the entire scenario you are dealing with, screenshot of the data model, details of how you want to visualize a result, and any other supporting links and details.
Including all of the above will likely enable a quick solution to your question.
I need to remove some sensitive information from the data model first and then I will post the .pbix.
A response on this post has been tagged as “Solution”. If you have a follow question or concern related to this topic, please remove the Solution tag first by clicking the three dots beside Reply and then untick the check box. Thanks!