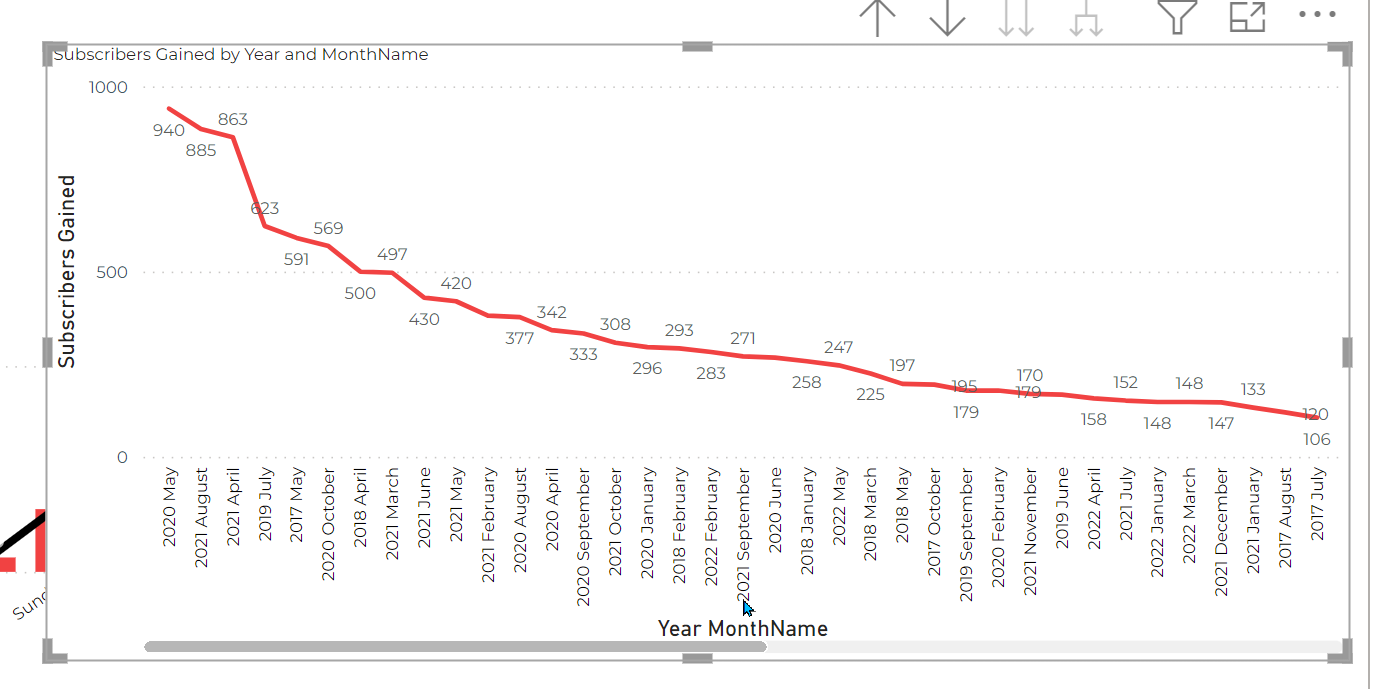
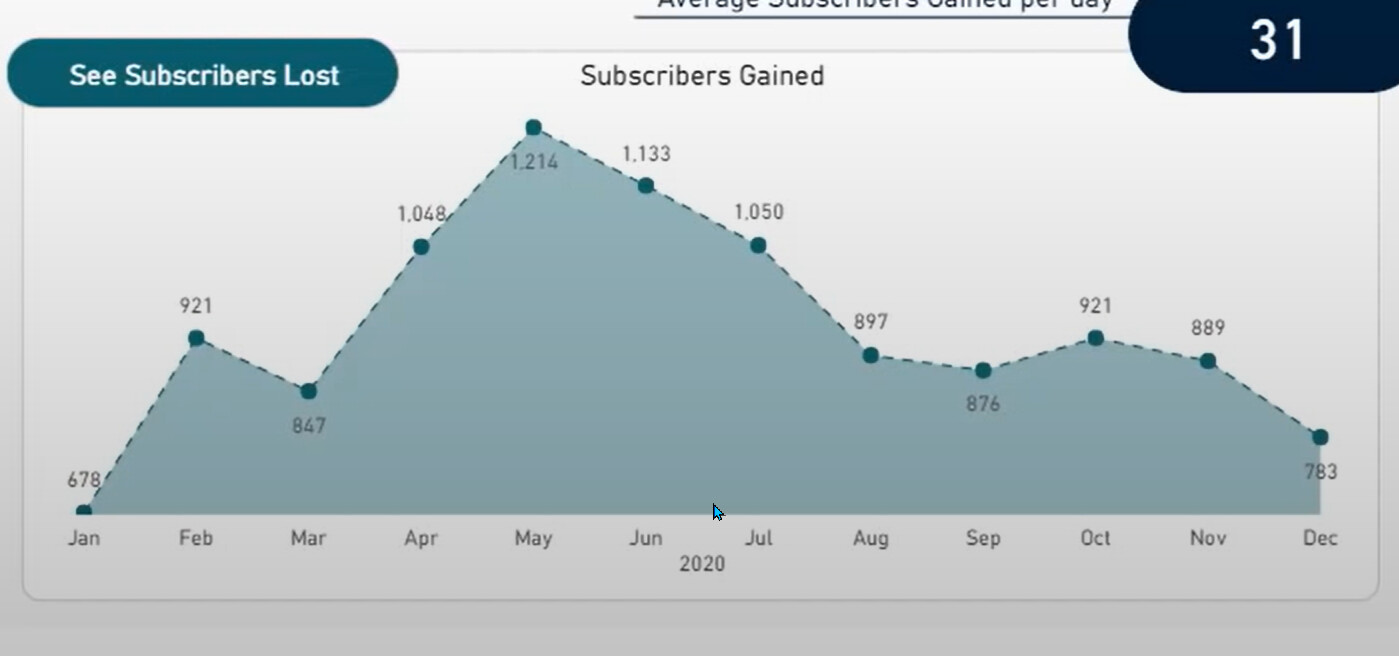
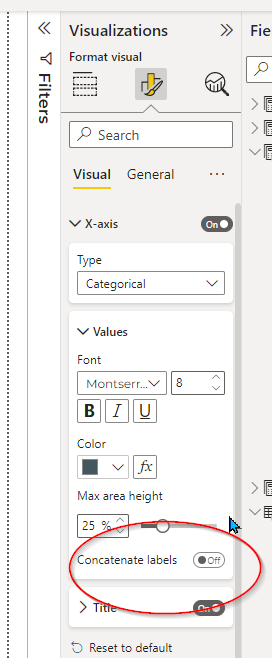
I am getting back into Power BI (after a short hiatus). I can’t remember if this is possible. I want to show Year and Month on a visual. Not like the first picture (picture#1) where they are concatenated but like Picture #2
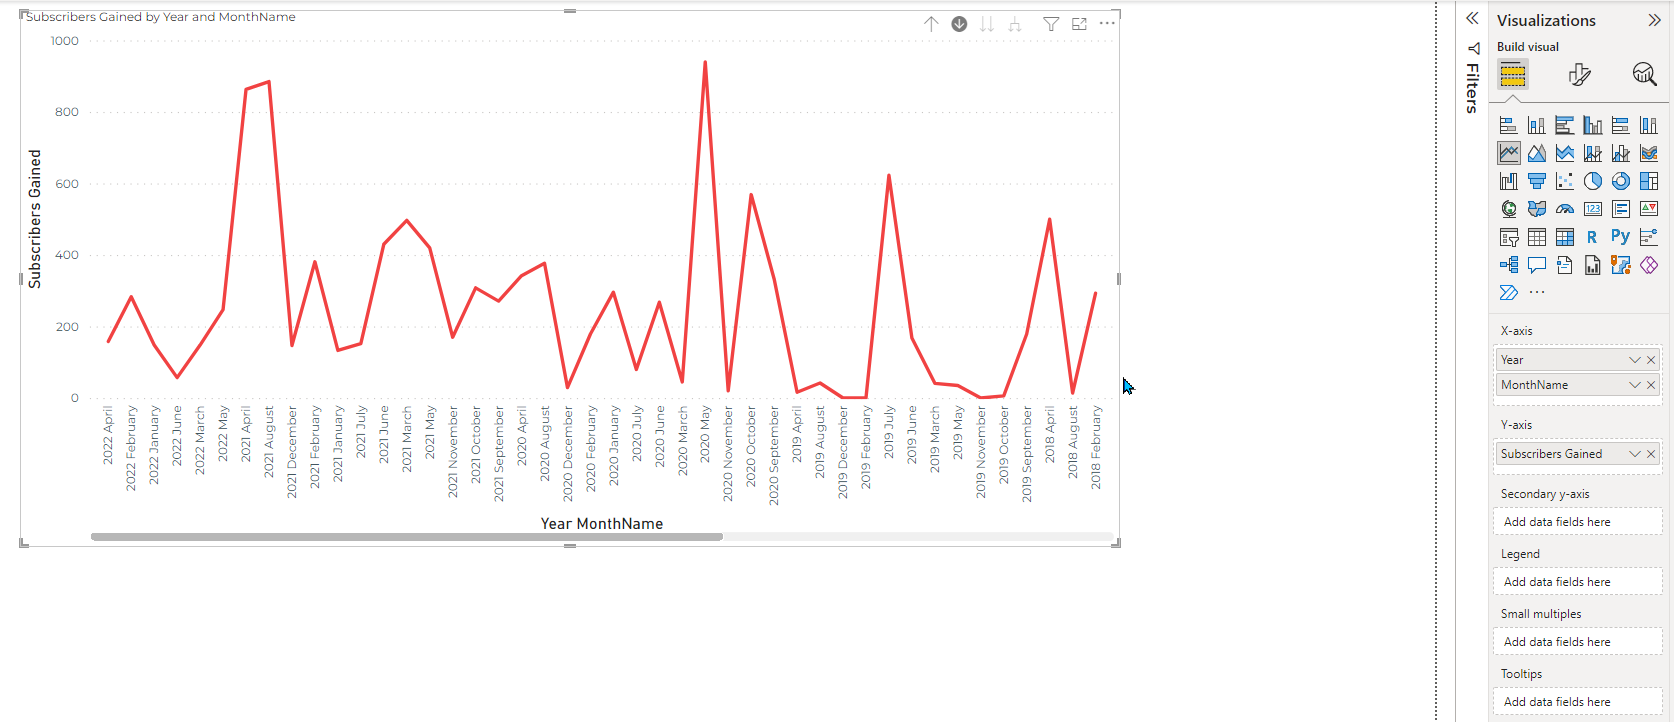
To achieve expected result (unconcatenated labels) I genuinely recommend to sort x-axis first.
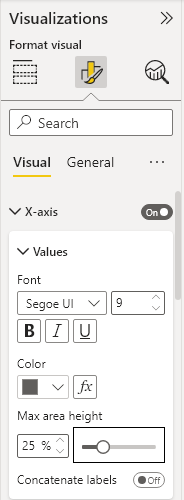
Looking at the screen we can tell that given period are not in chronological order, thus they are resistant for being structured (unconcatenated). You can apply preferable sorting using “…” options.
Hi @mbraun, looks like you’ve made progress on your query on your own. Do you still need any assistance here? If none, kindly close this thread by tagging a post as “solution”. Thanks!